Engine details page
Overview
In the DCT UI, navigate to Data > Data Infrastructure > Data Engines, where you can view all of your DCT-connected Delphix engines. Select View for an engine in the list to see its corresponding "details page," which has categorized information, data on the engine, and actions that can be performed.
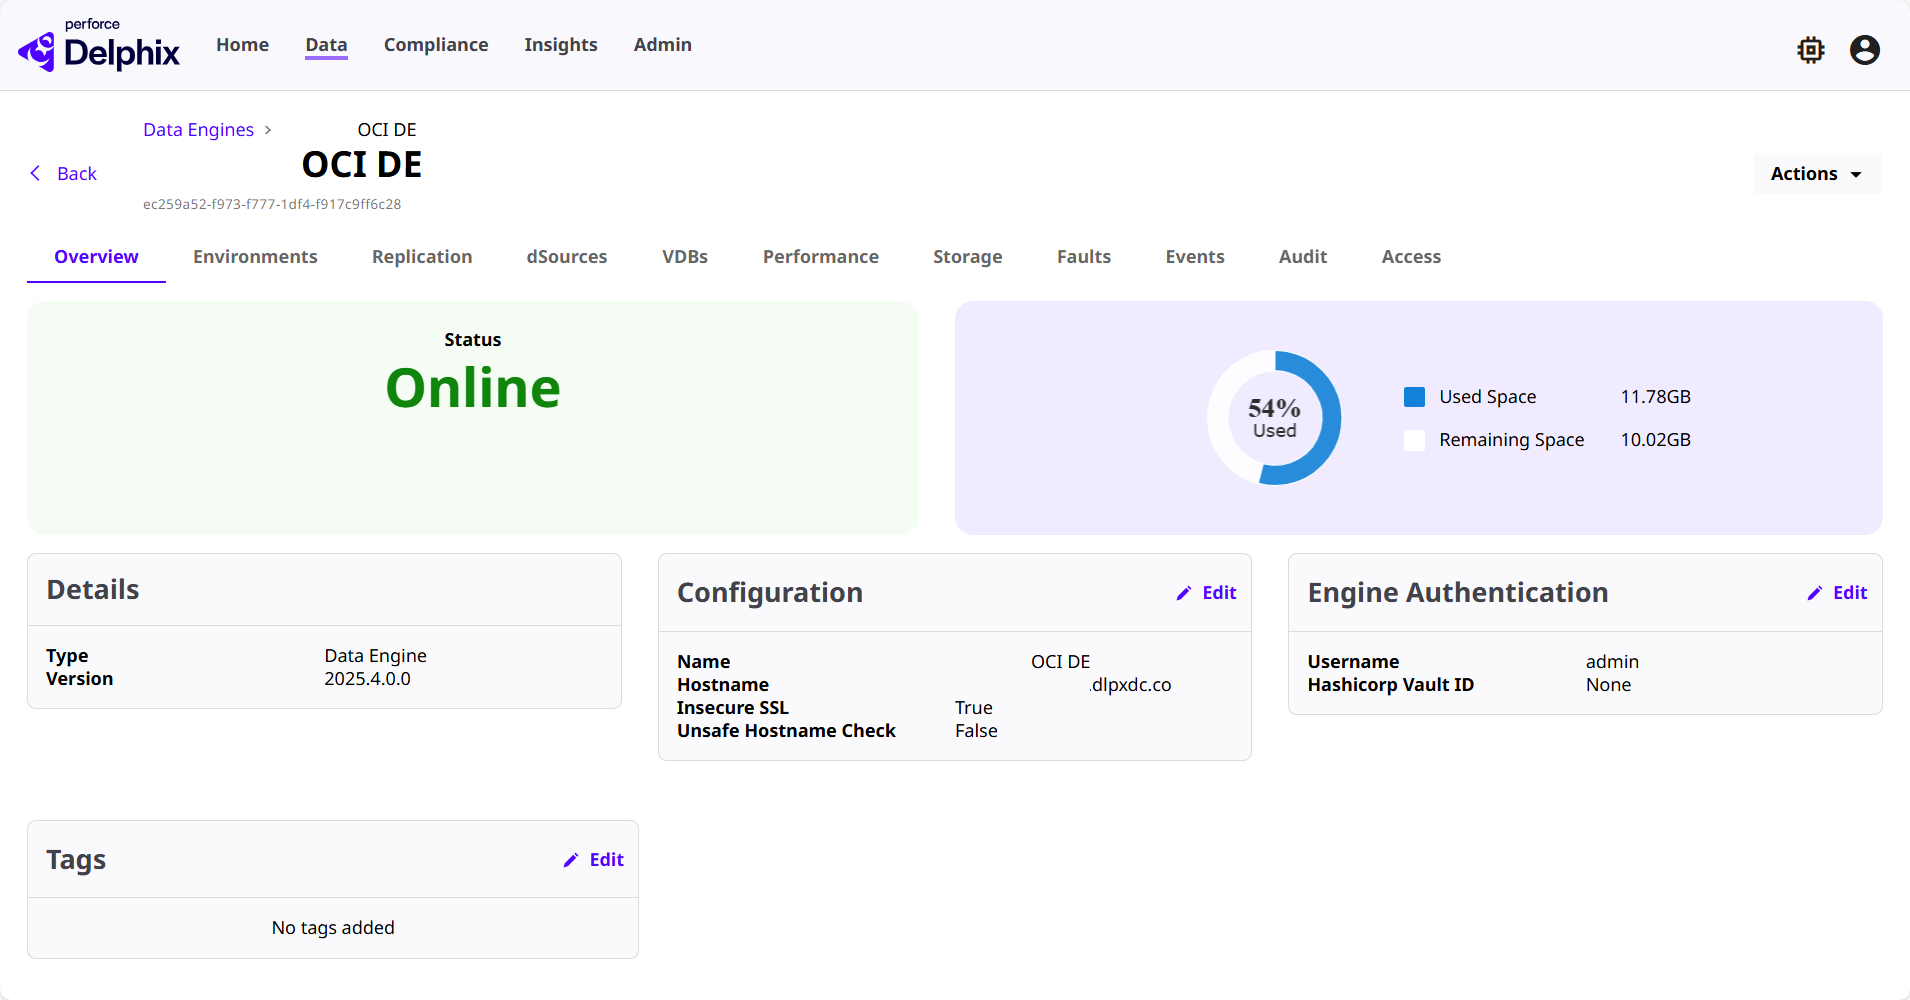
The Overview tab shows provides the following information:
-
Status: Shows the active engine status, like Online or Offline.
-
Storage preview: Shows a preview of how much storage the engine is using.
-
Details: Shows the engine type and version its on.
-
Configuration: Shows the name of the engine, the hostname address, whether or not its an insecure SSL connection, and whether or not its unsafe to check the hostname.
-
Tags: Shows any associated tags with the engine.
Use the Actions menu to dregister the engine, if needed. This action can also be done via an API call:
curl --location --request DELETE '<https://<DCT Host Name>:<Port>/v3/management/engines/<ID or Name of the Engine to be deleted>' \
--header 'Authorization: apk <api key for authentication>'
Upgrade engine orchestration
When the feature is enabled for your environment, the engine details page also exposes upgrade actions related to the DCT-managed engine upgrade workflow. These actions let an operator review the upgrade image, select the engine or engines to upgrade, and monitor each phase of the lifecycle from one place.
Operators can view the upgrade status as the workflow progresses through pre-upgrade validation, transfer, verification, and apply. In this preview, if an apply-phase or validation issue occurs, the upgrade moves to a Deferred state; automated recovery and remediation actions are not yet available from the details page and are planned for a future release.
Environments
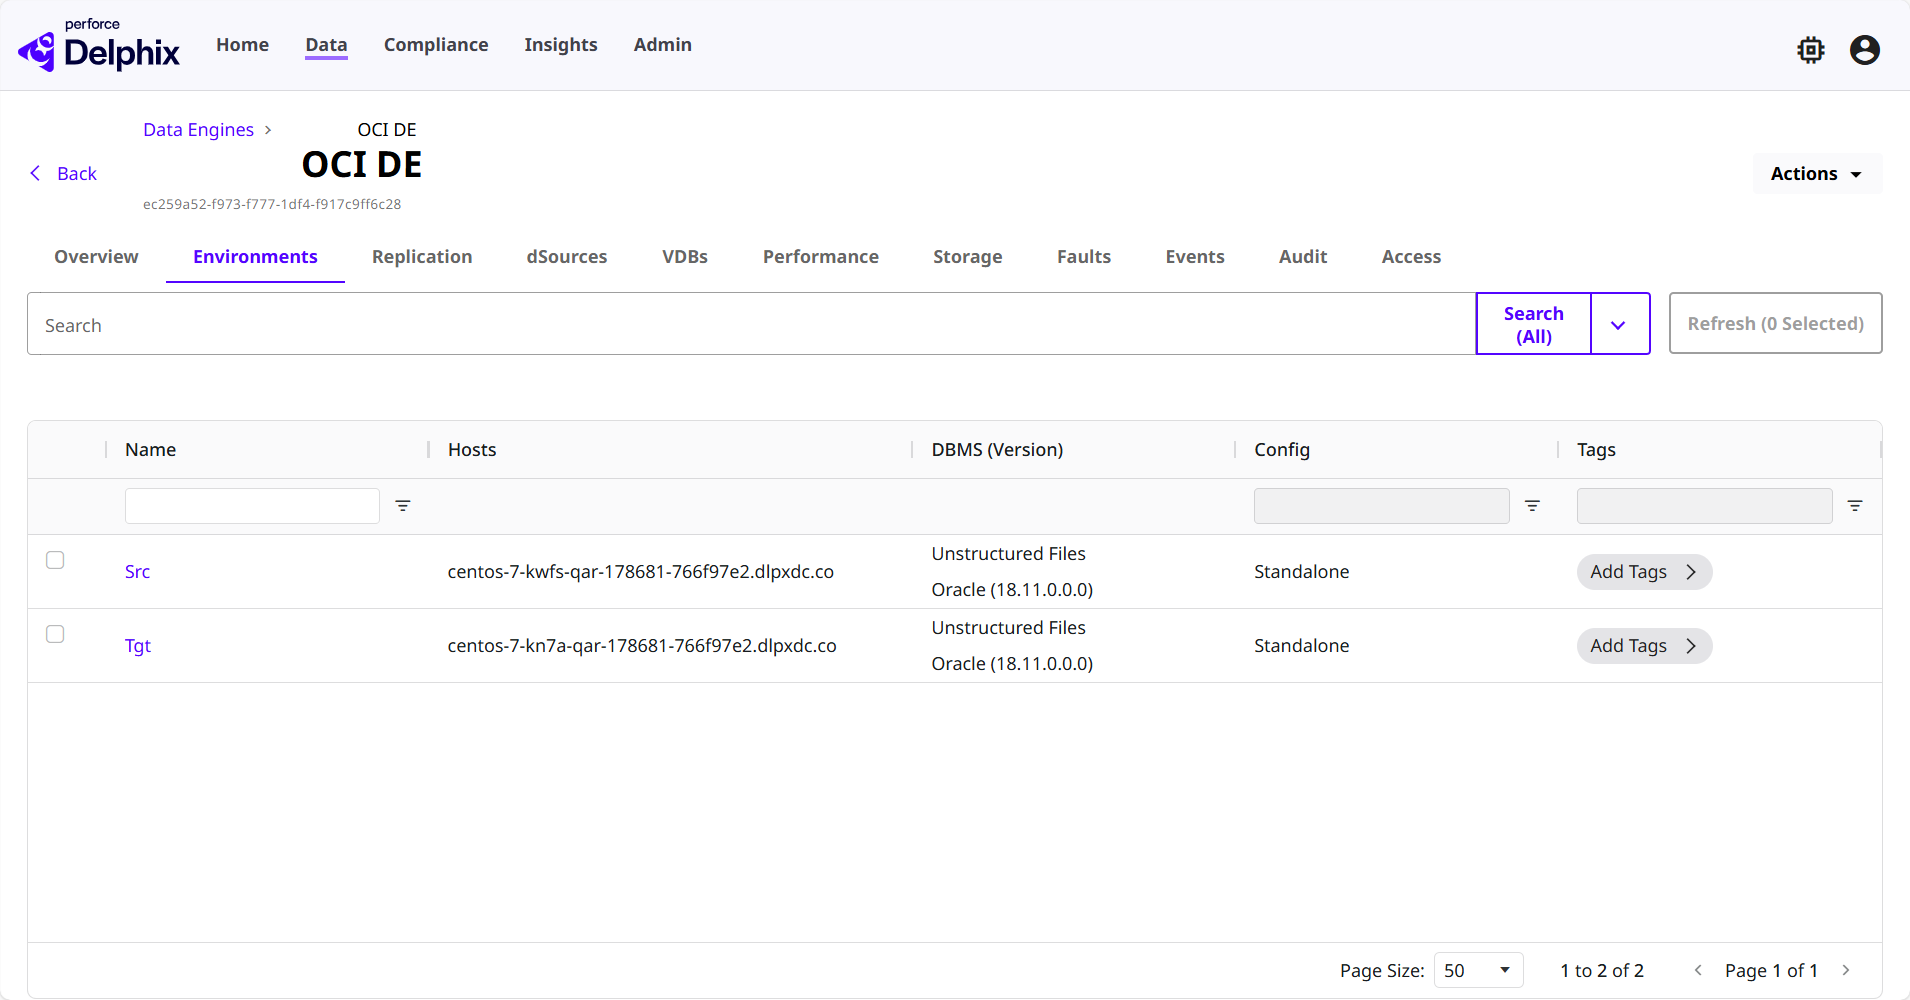
The Environments tab shows all environment connections to the engine, along with information like the environment's name, host address, database management software version, whether it's a standalone or multi-tenant environment, and associated tags.
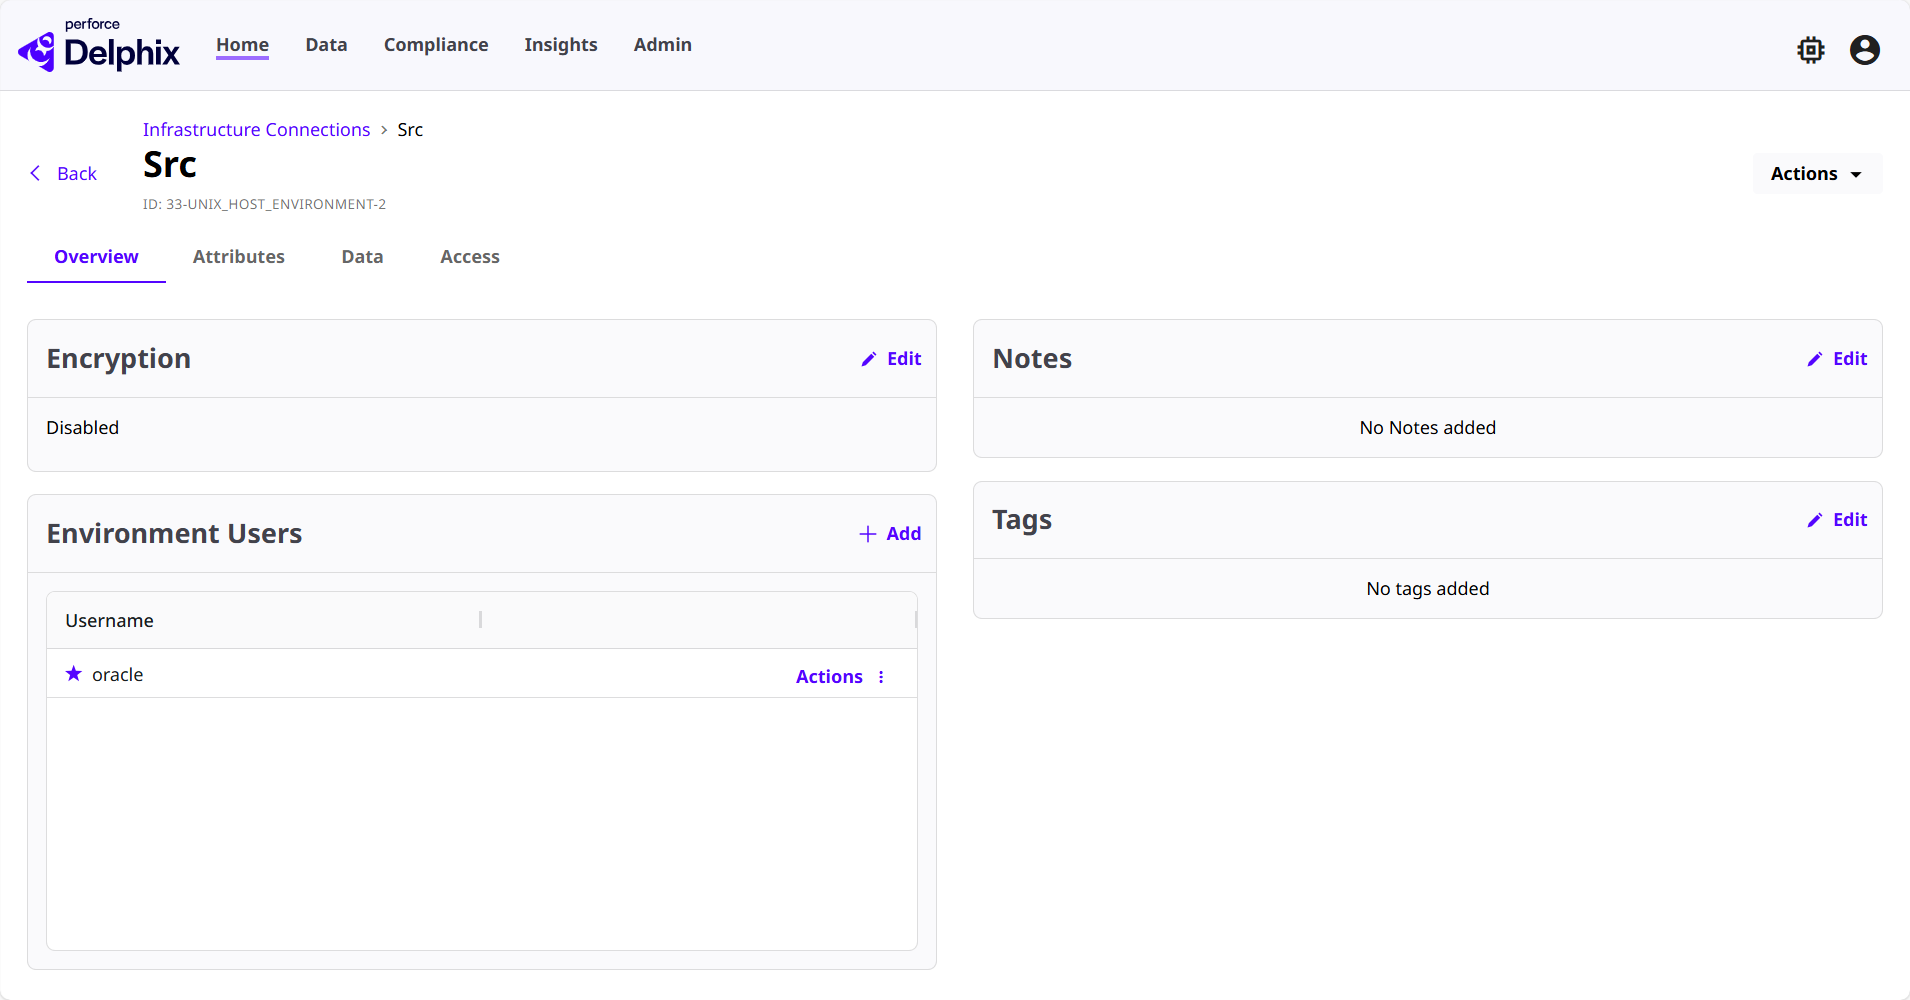
Selecting an environment from the list will bring you to the detail page for it. This page is outside of the engine detail page, which you can access again by clicking Back in the top left. The environment overview page shows whether or not encryption is enabled, who the environment users are, and any notes or tags associated with it.
Replication
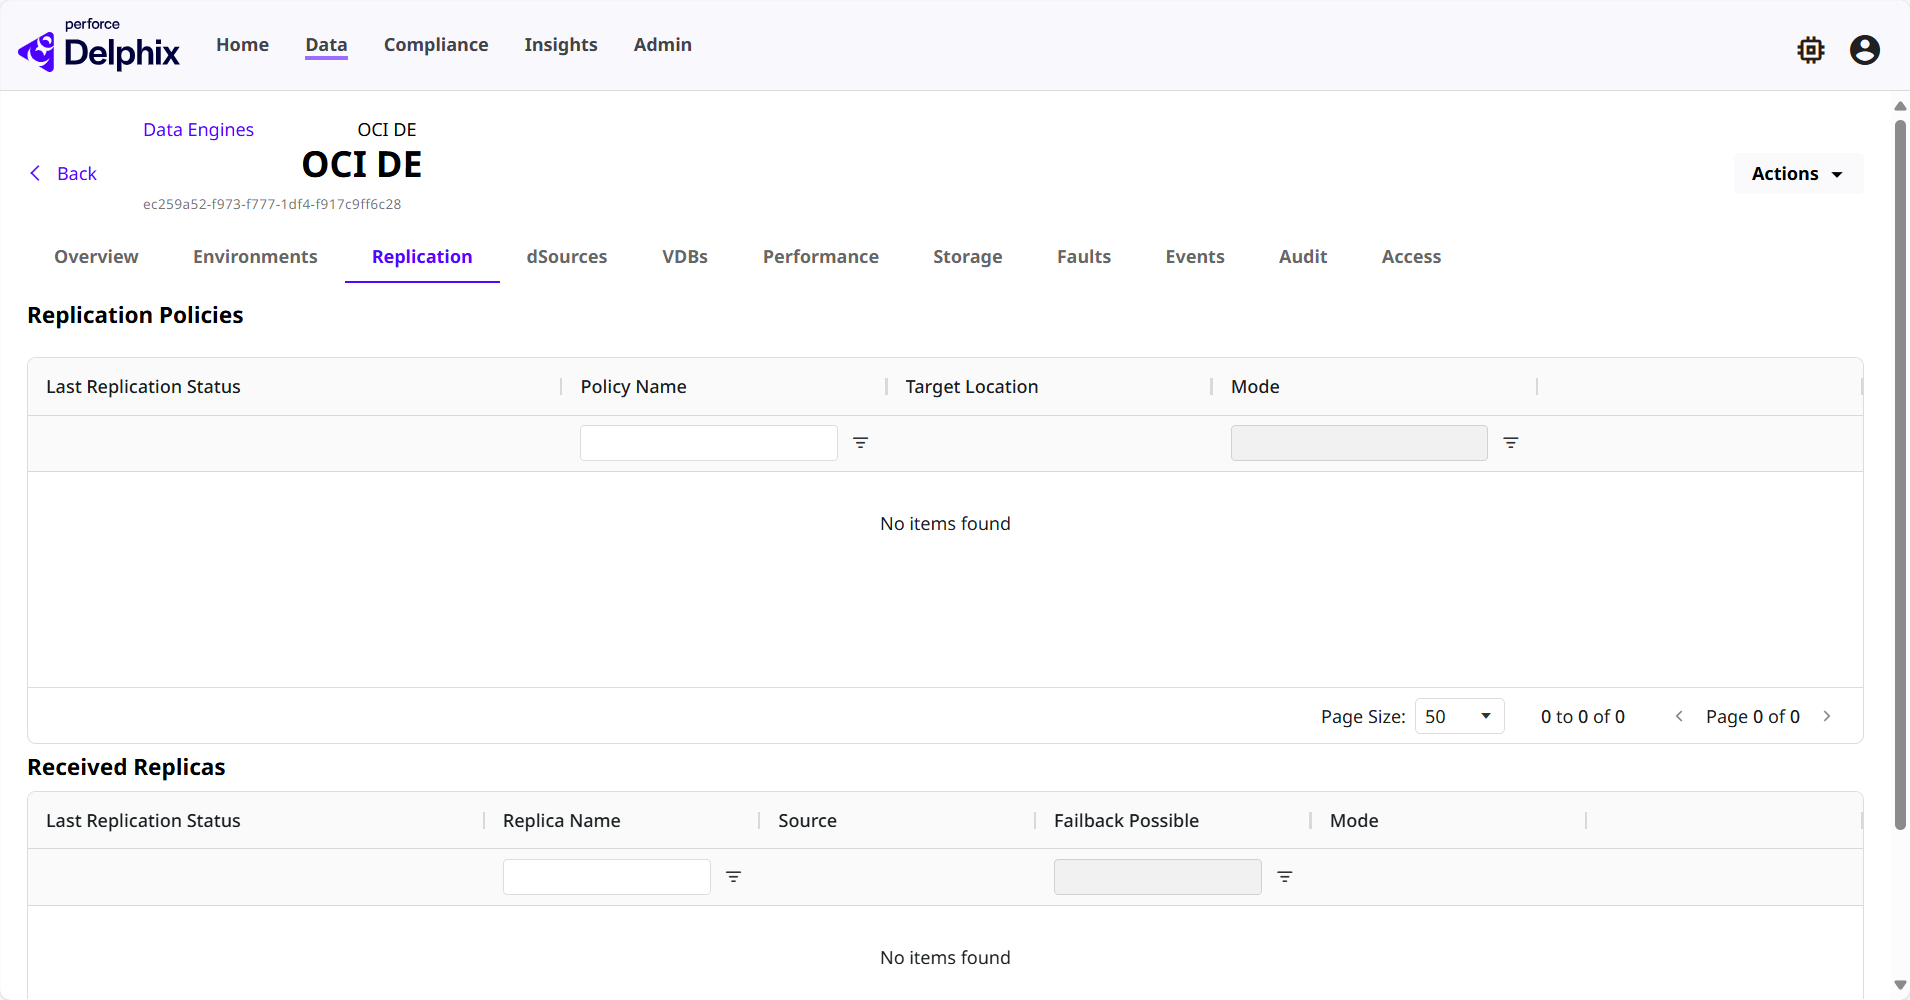
The Replication tab shows any replication policies associated with the engine, along with their last status, name, the targeted location of the policy, and the mode its running in. It also shows received replicas to the engine, along with the same information as the policies.
dSources
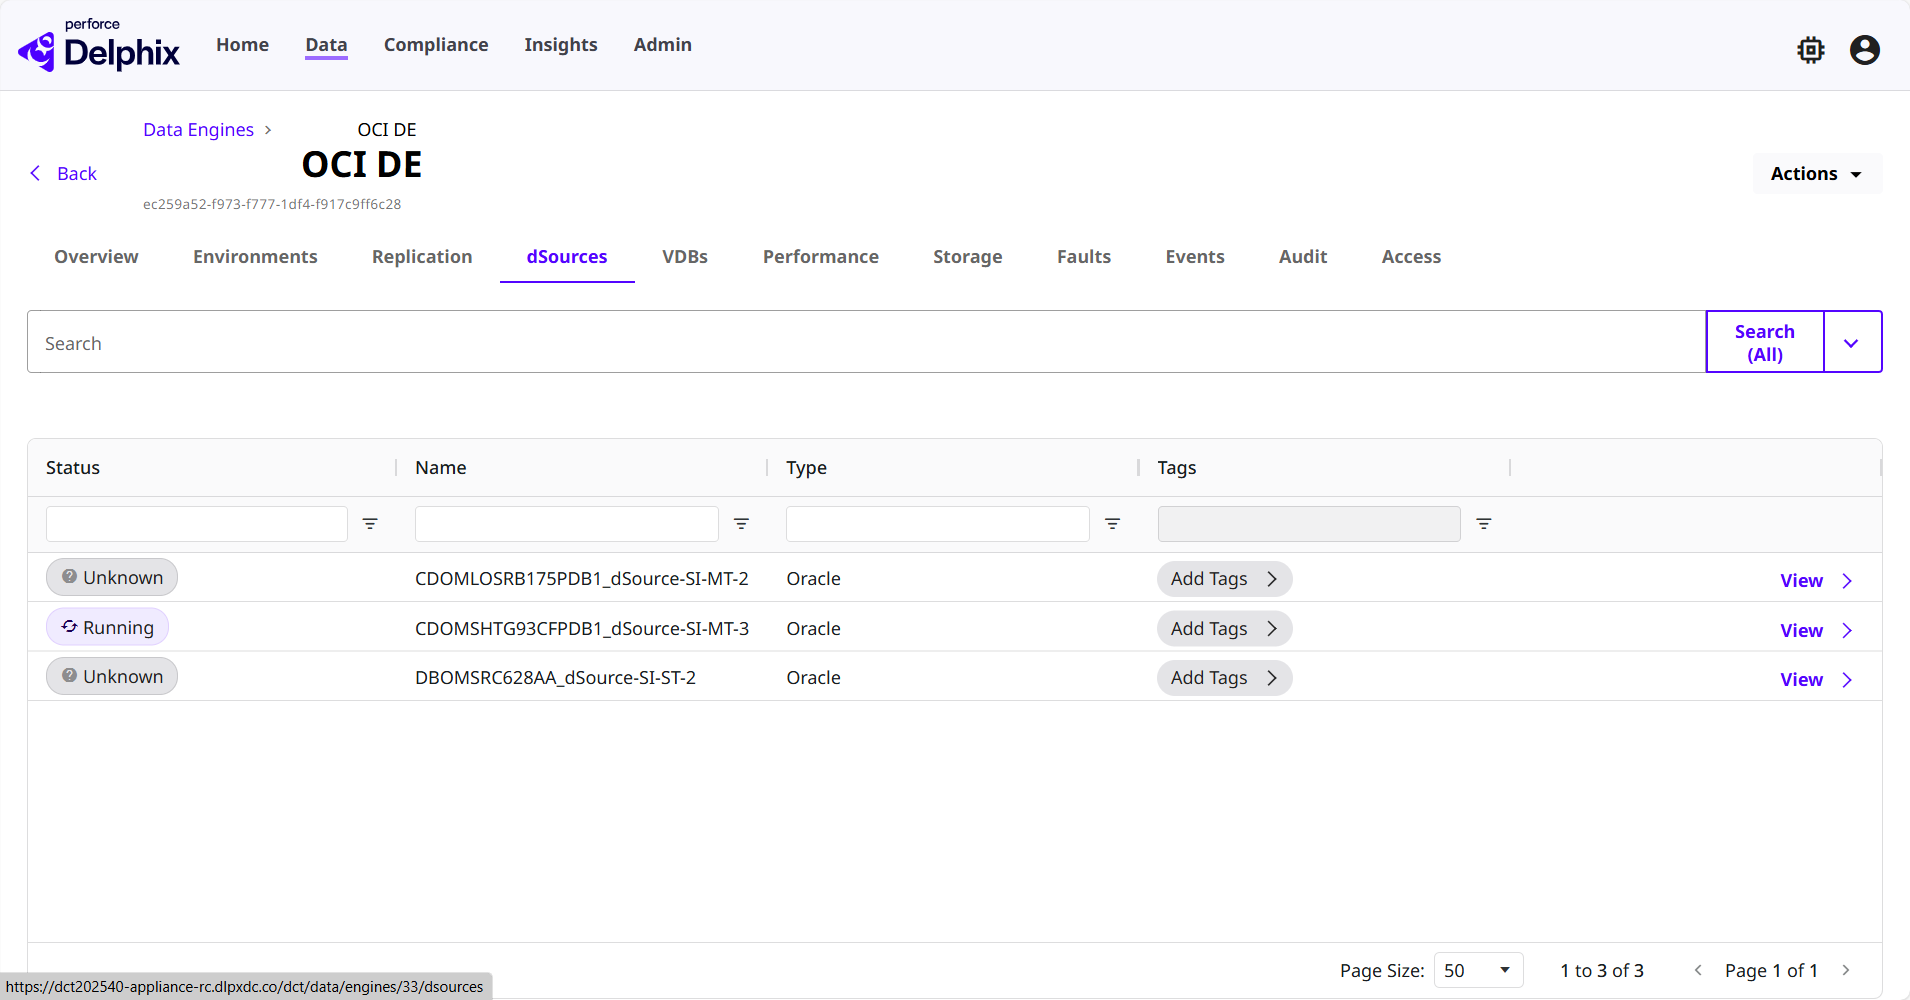
The dSources tab shows all dSources associated with the engine, along with their active status, name, database type, and associated tags. Clicking the View button on an item in this list will move you to the selected dSource detail page.
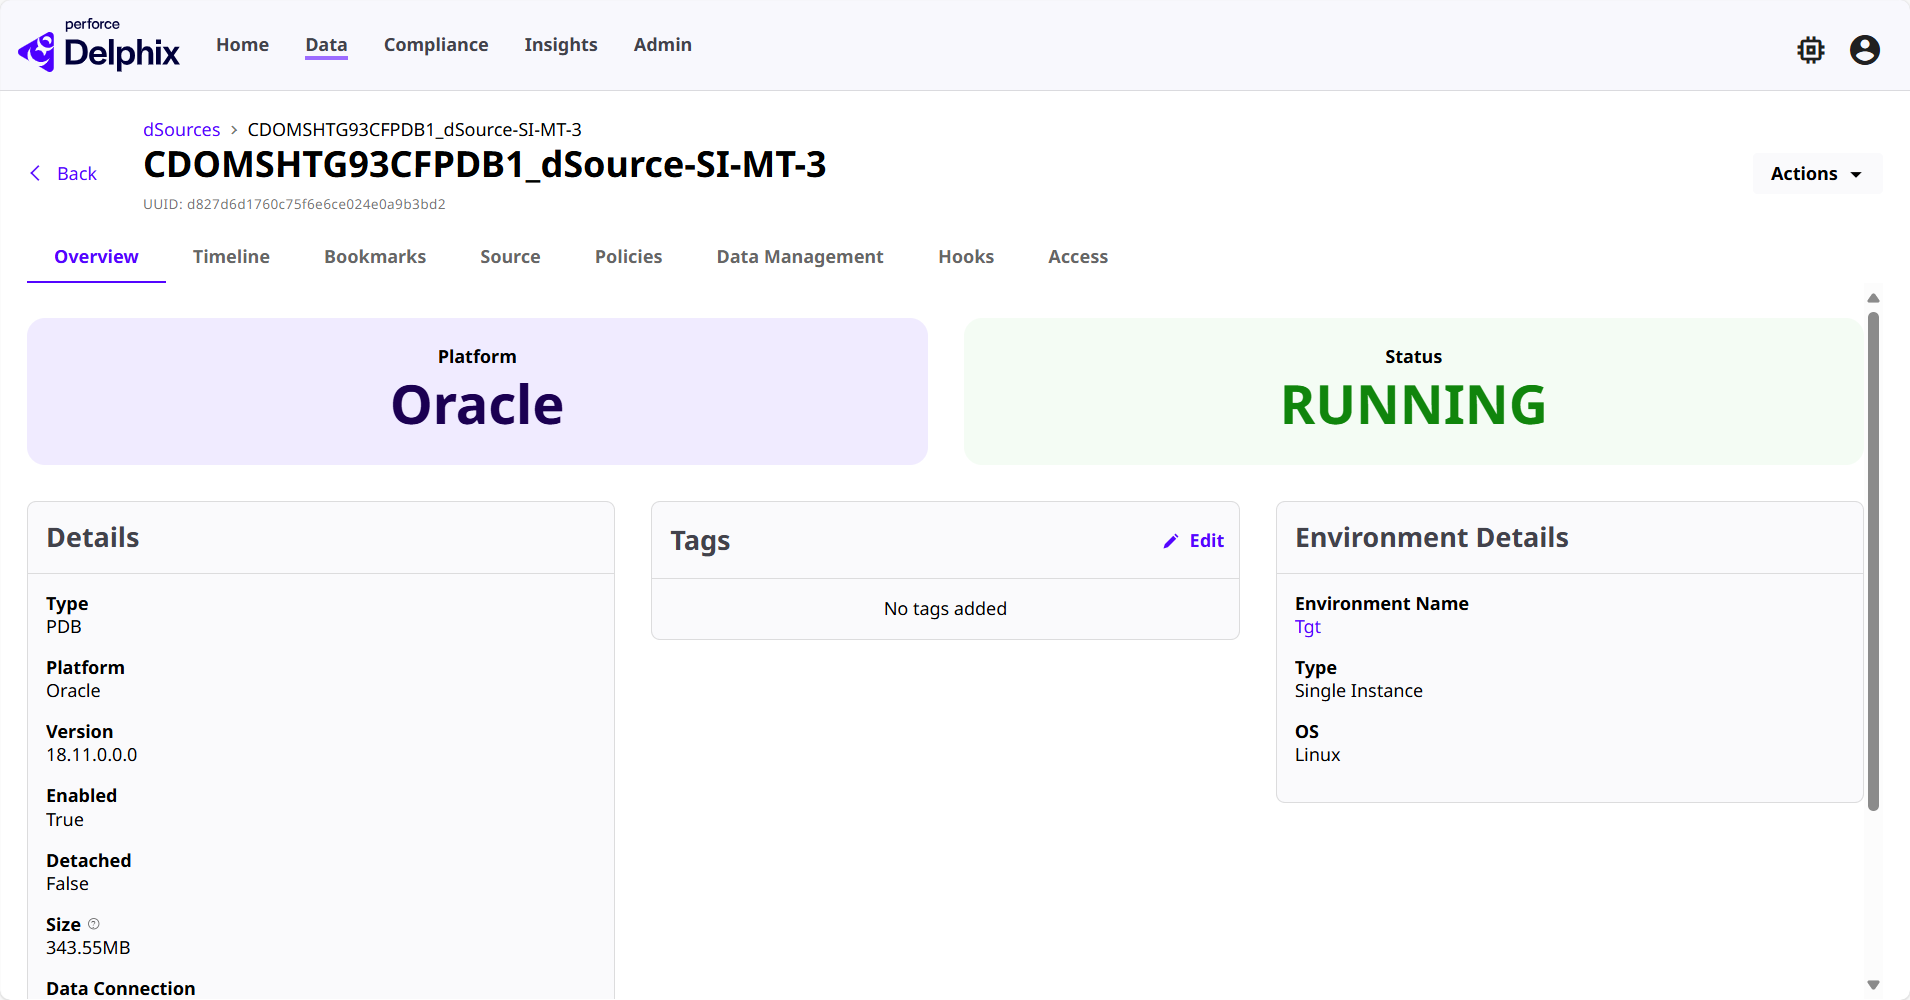
To return to the engine detail page, select the Back button in the top left. On the dSource detail page, you will find a similar layout of information to the engine's Overview tab, except it is related to the dSource.
VDBs
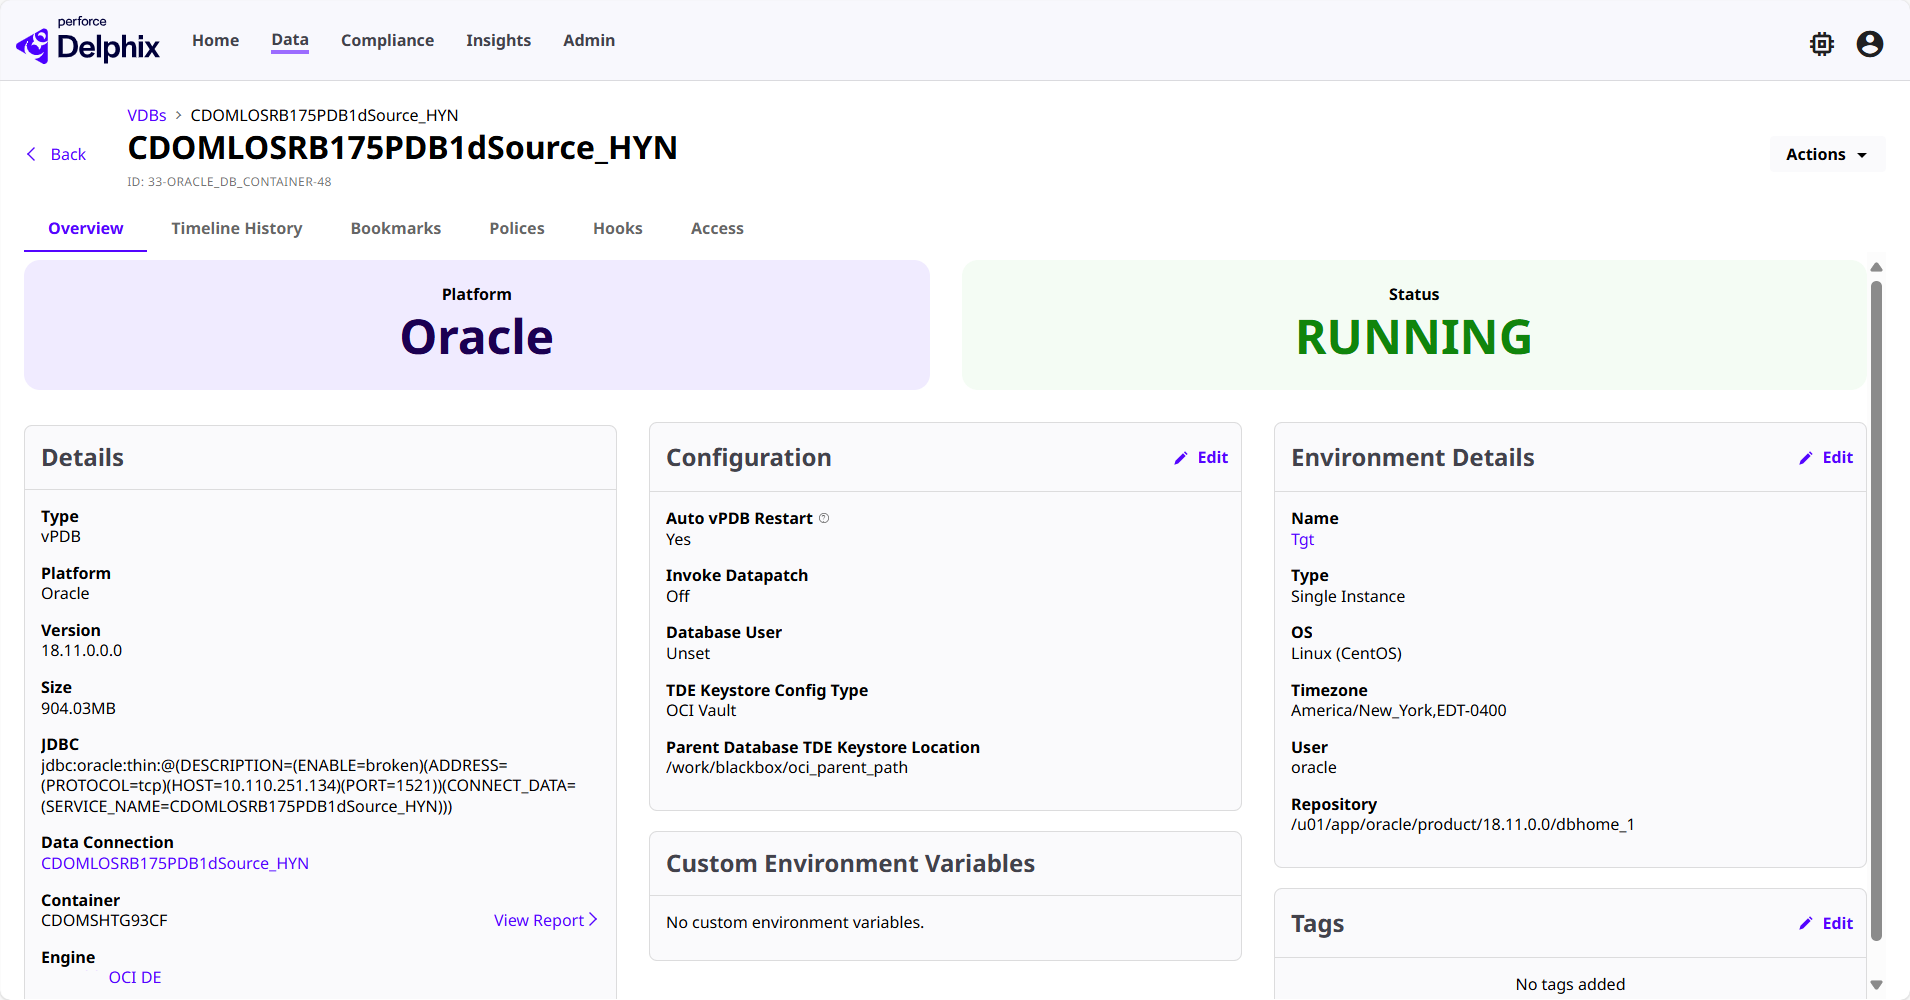
The VDBs tab shows all VDBs associated with the engine, along with their active status, name, database type, and associated tags. Clicking the View button on an item in this list will move you to the selected VDB detail page.
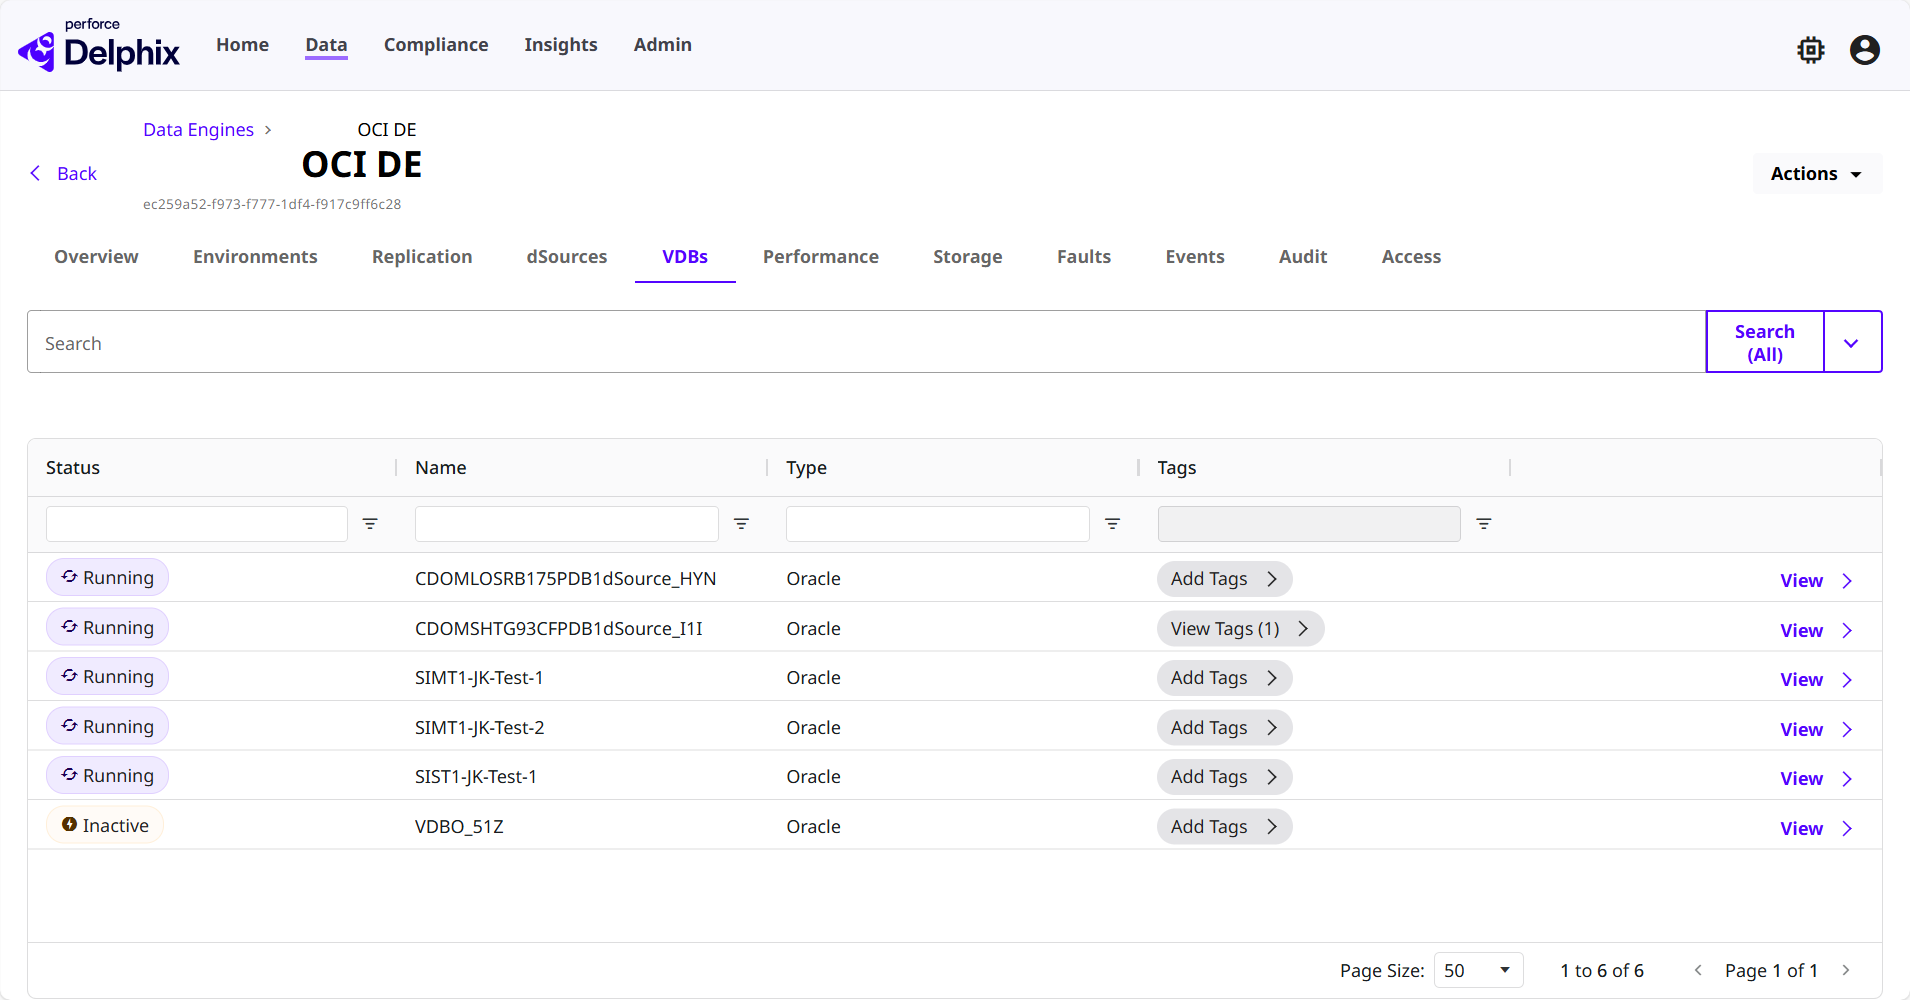
To return to the engine detail page, select the Back button in the top left. On the VDB detail page, you will find a similar layout of information to the engine's Overview tab, except it is related to the VDB.
Performance
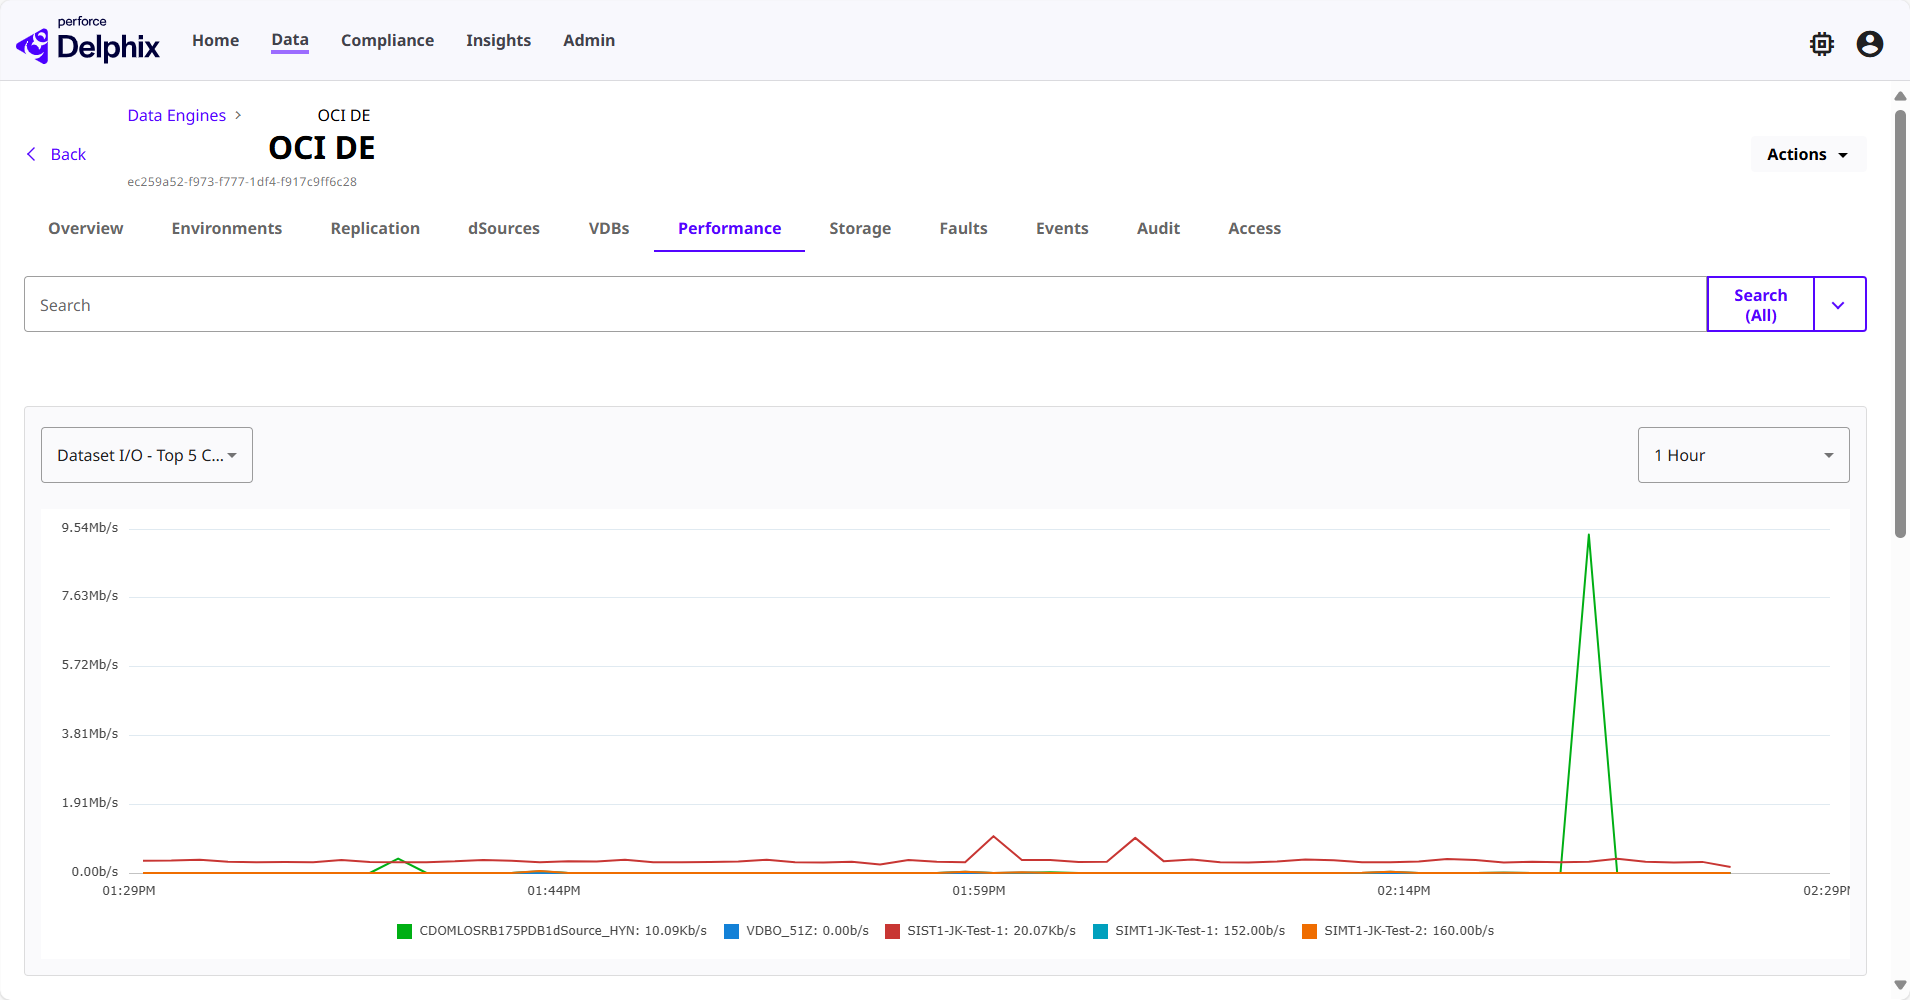
The Performance tab shows total network I/O throughput for reads and writes combined for the five most I/O-intensive datasets on the engine. The chart displays throughput in bits per second (b/s, Kb/s, or Mb/s). A dropdown at the top allows you to switch between one, 6, and 24-hour periods.
Each point on the graph represents an average over an interval that depends on the selected time range. Throughput values can change when you switch time ranges because each point represents an average over a longer or shorter interval.
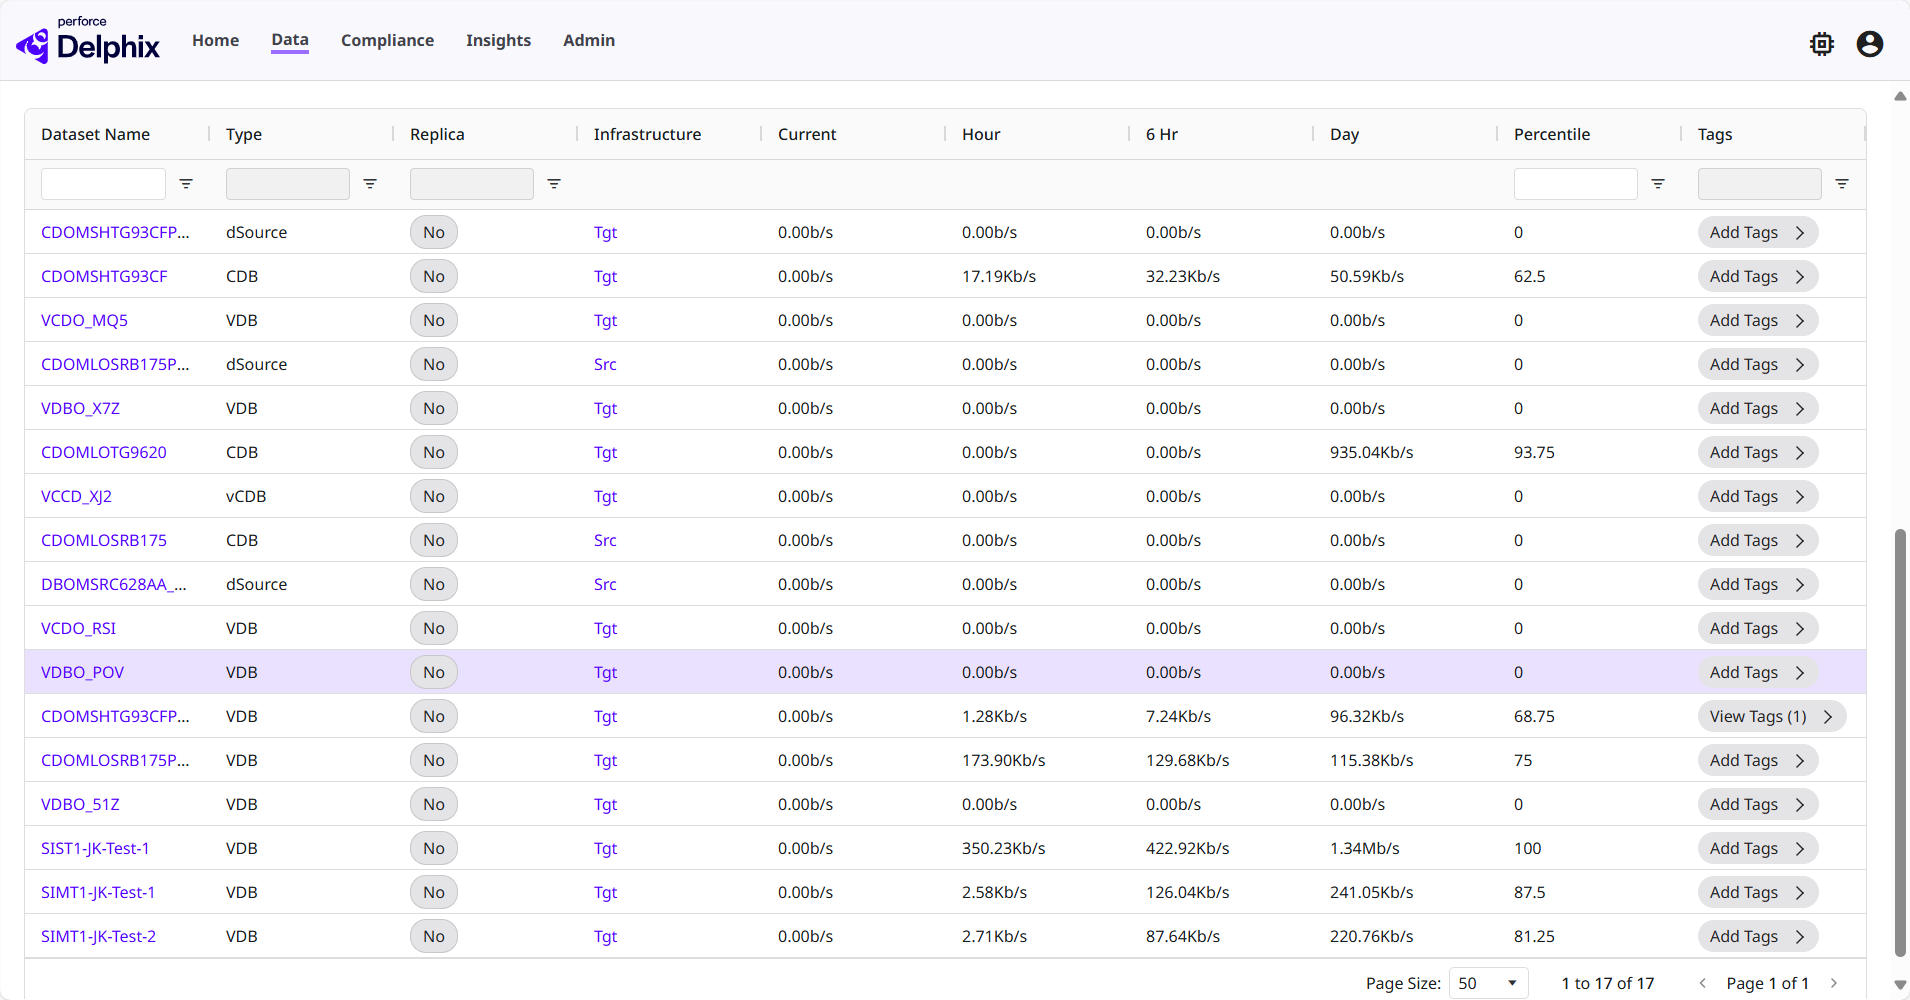
The columns in the list for each dataset contain information like the dataset name, what type of data it is, if it's replicated, whether it's source or target infrastructure, the current, hourly, 6 hour, daily, and percentile summaries of throughput, and associated tags.
Storage
For an in-depth breakdown of what you can expect to find in the Storage tab of an engine's details page, visit the Storage tab topic.
Faults
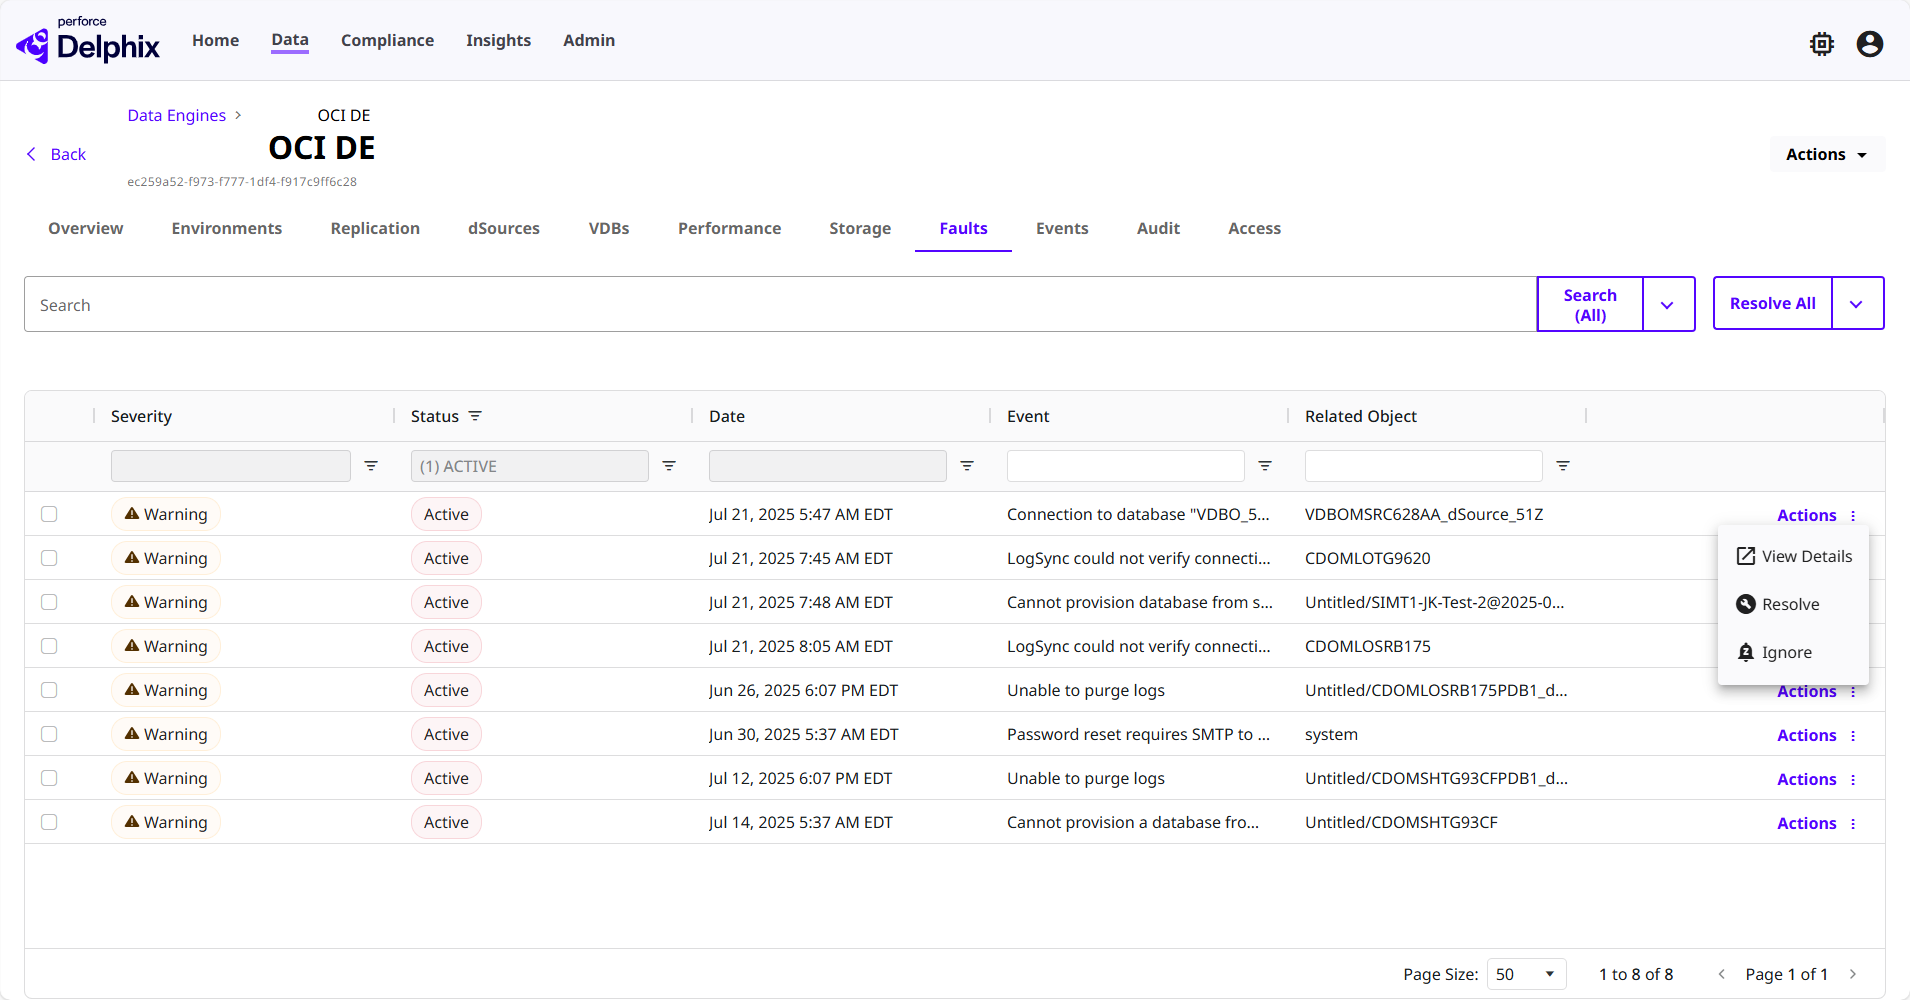
The Faults tab shows any faults or nuances that have occurred on the engine. You can engage with the Actions button on any fault line item to view details. resolve the fault, or choose to ignore it.
Events
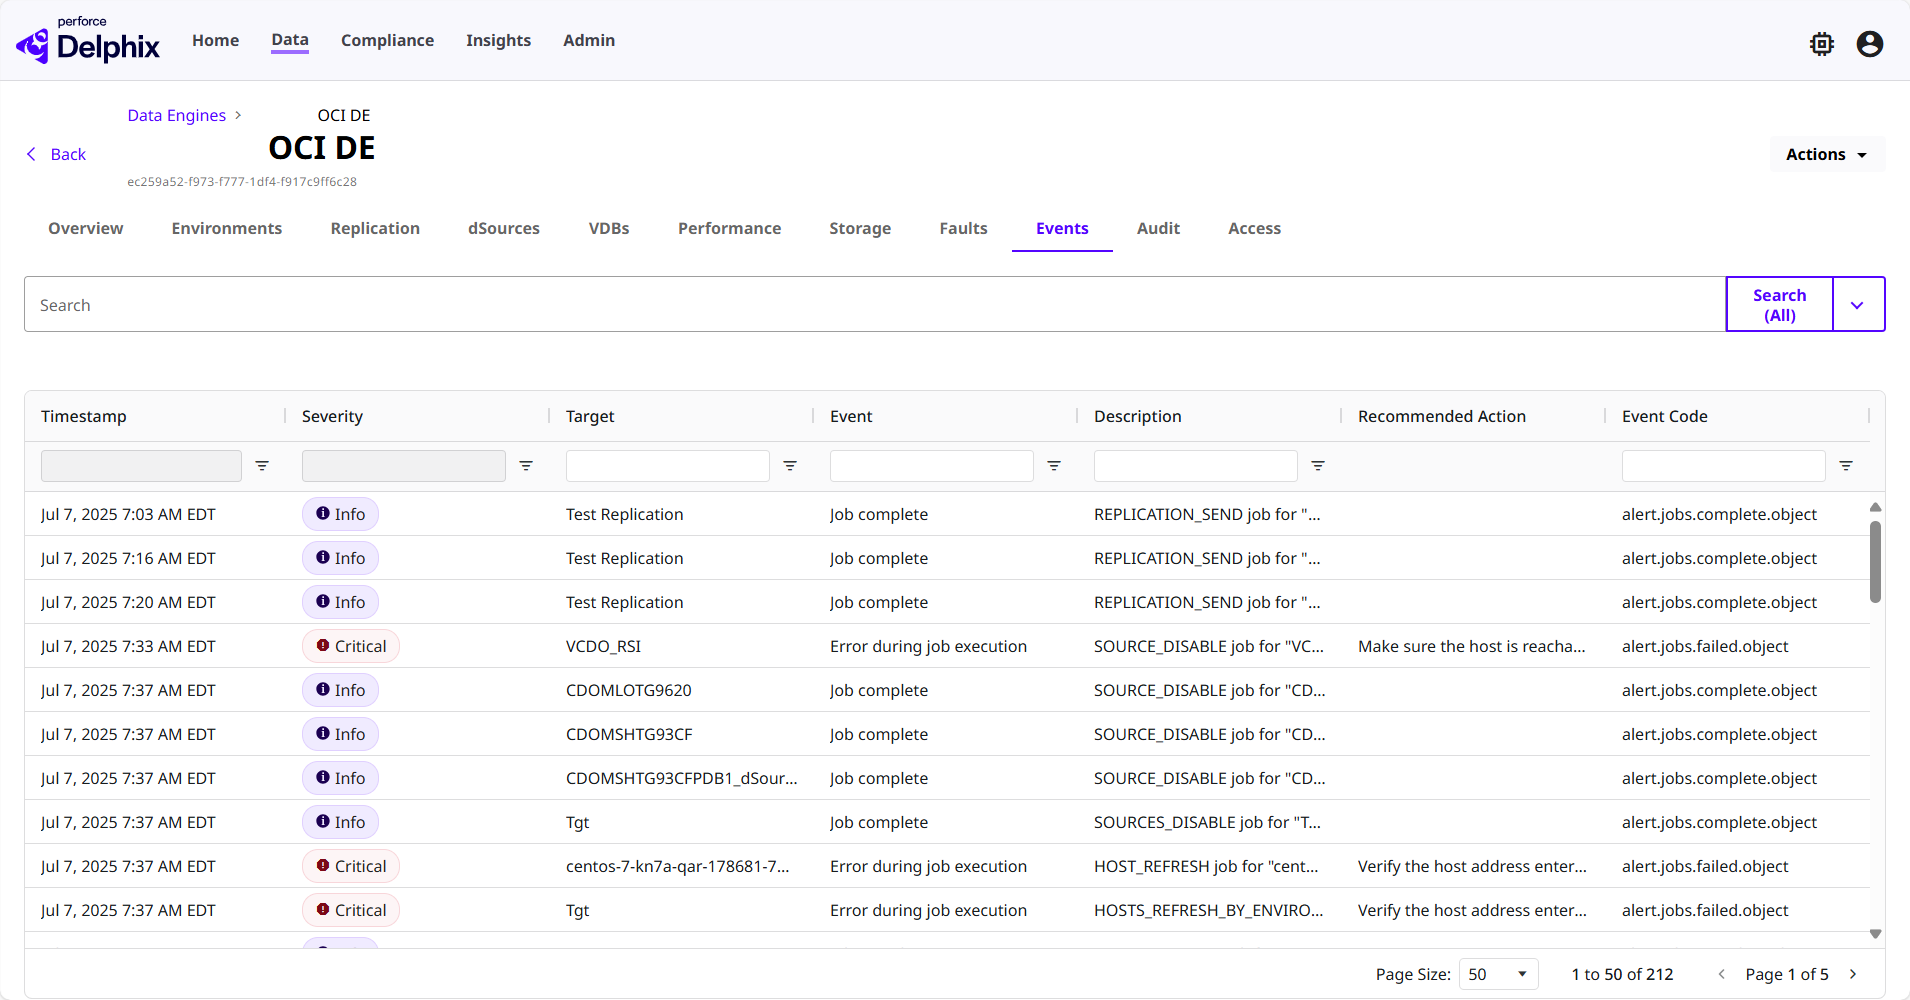
The Events tab shows all of the completed job actions associated with the engine. Information pertaining to each event contains a timestamp, the severity of the event, the target, event type, a description, recommended actions (if any), and an event code for reference.
Audit
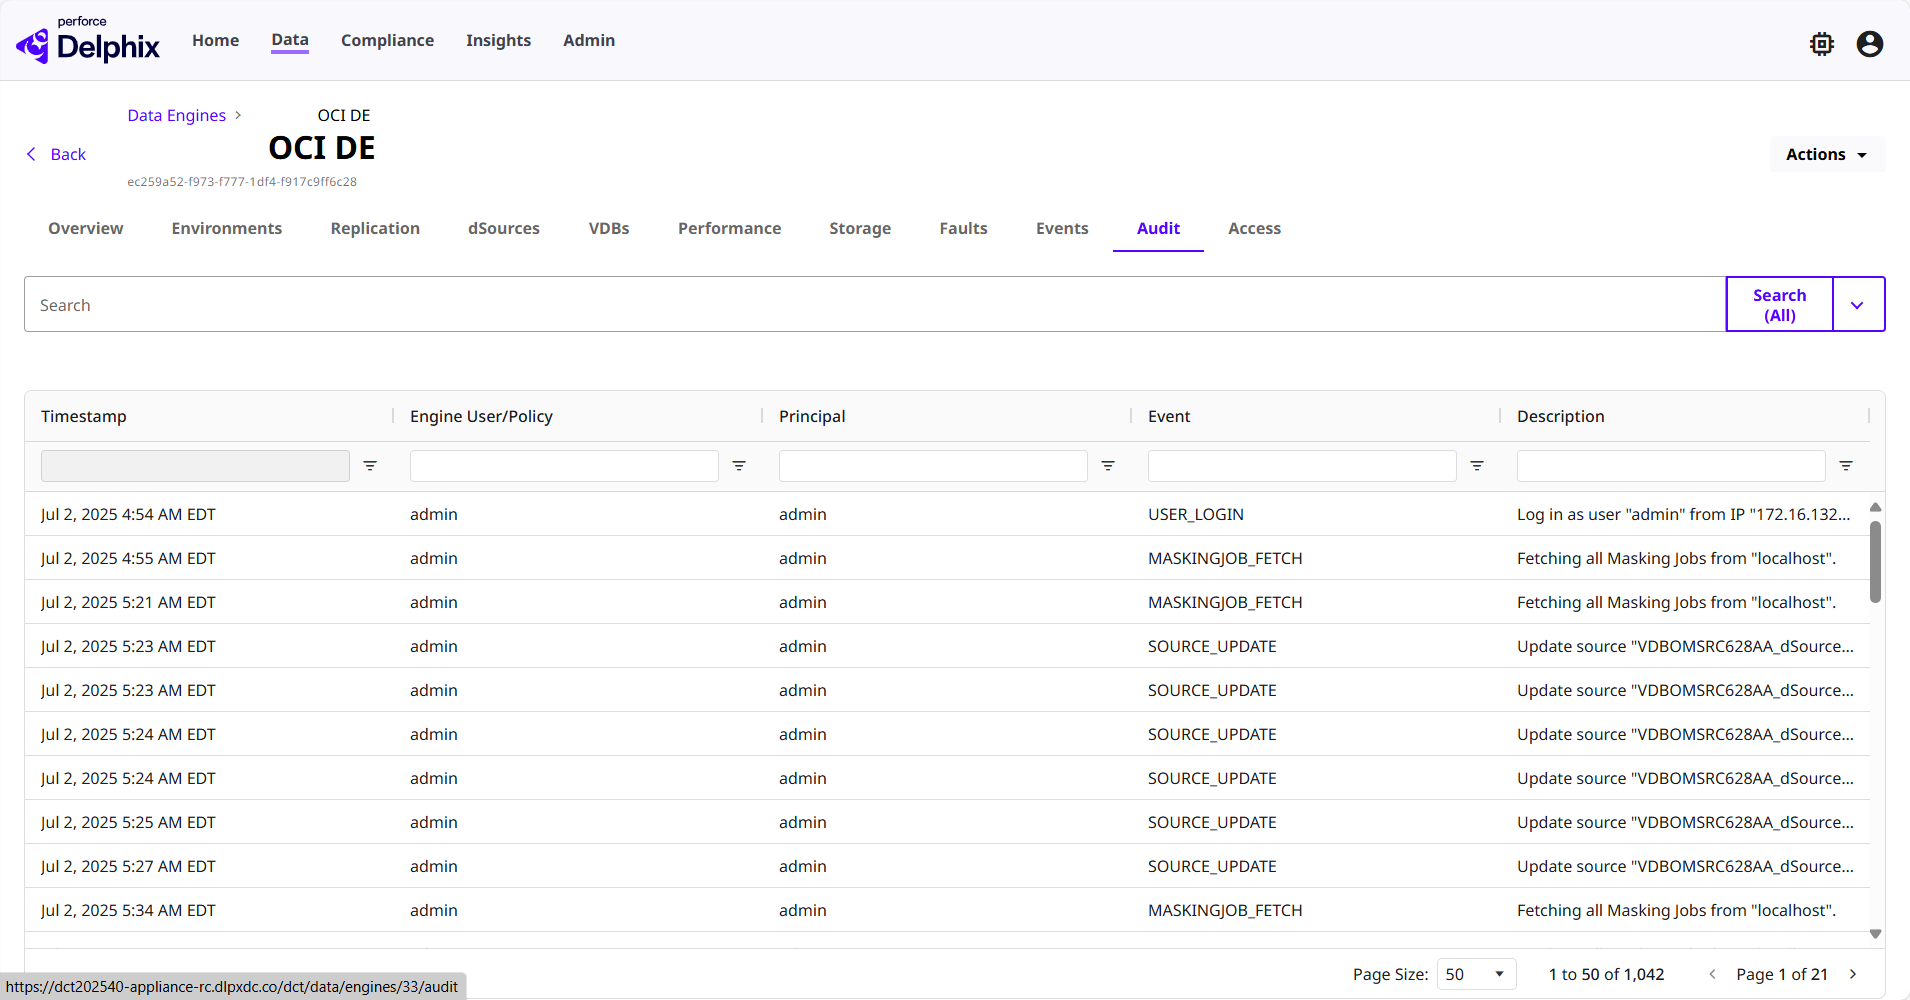
The Audit tab shows all associated audits performed on the engine. Information pertaining to each audit includes a timestamp, who the engine user was to initiate the policy, the principal user, what kind of audit event occurred, and a description.
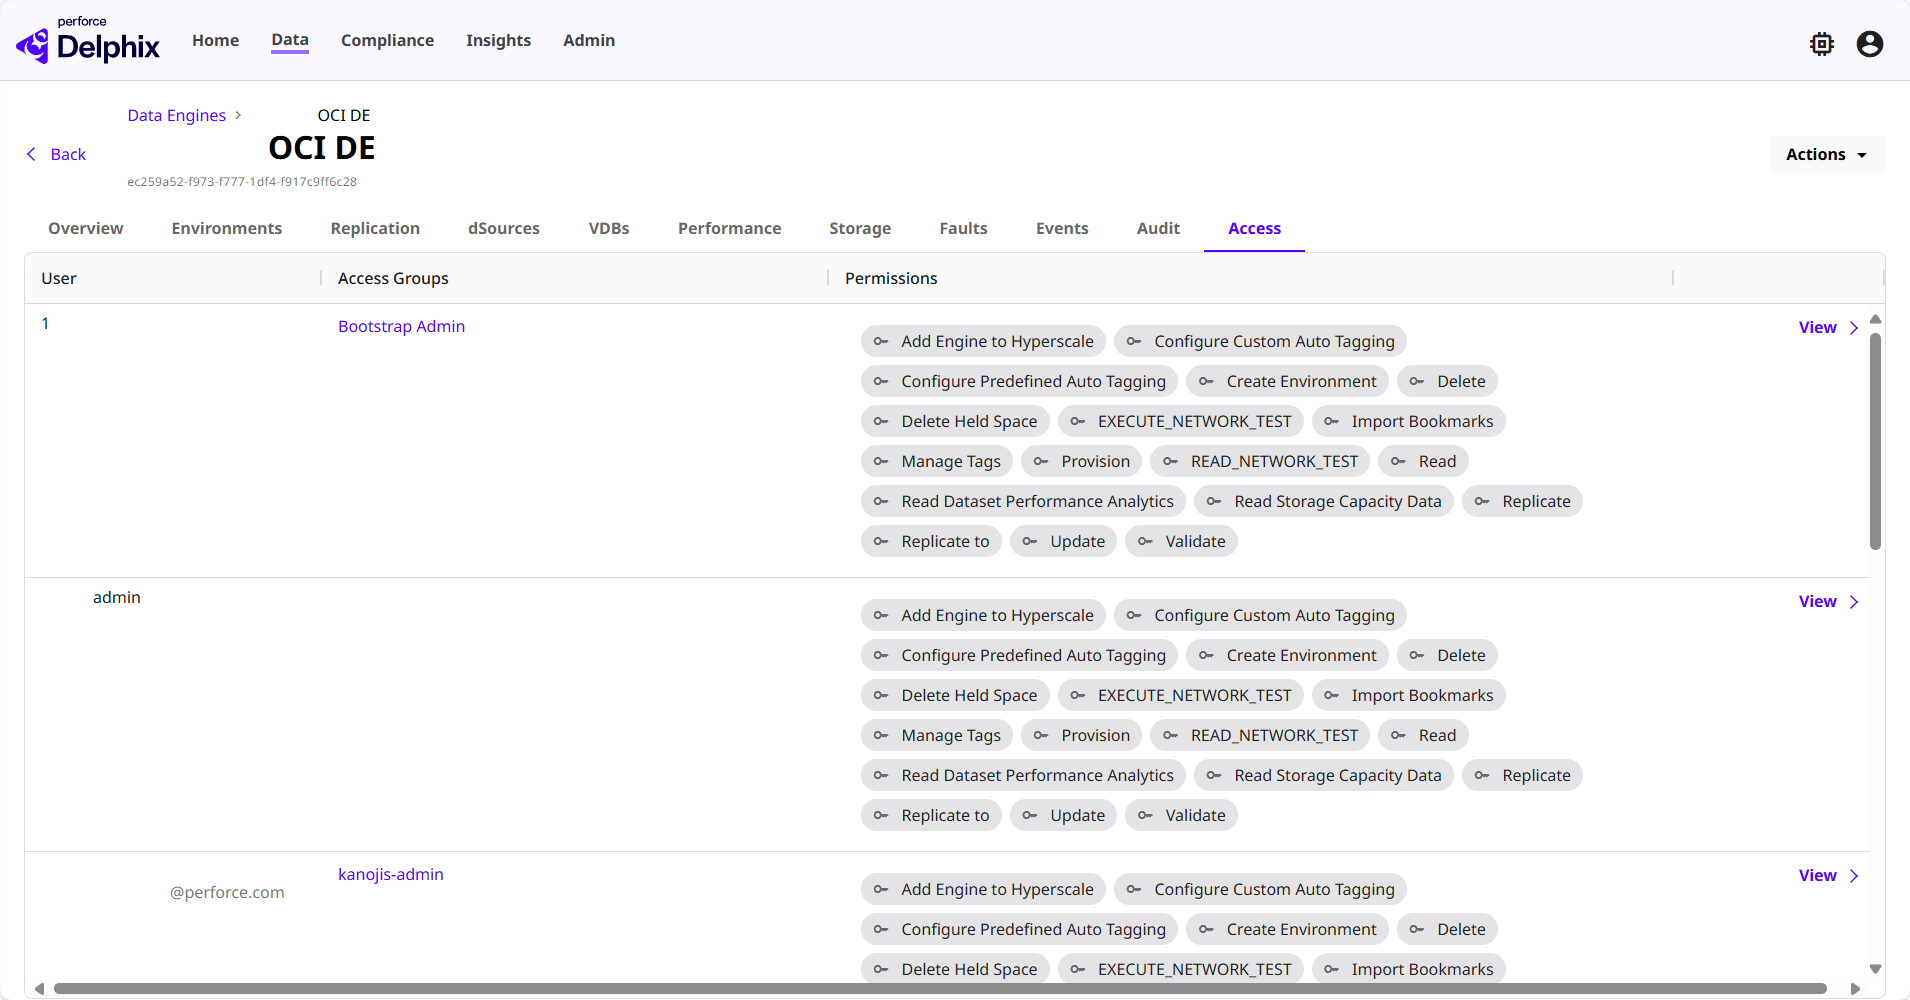
Access
The Access tab allows admins to audit which users have operations access to the engine, what access group they belong to, and the associated permissions that each user has on this engine. Admins are able to click on the View button to see additional details under the access control screen (related to the specific, selected user).