Storage tab details
Overview
The Storage tab shows detailed information about the space occupied by datasets on the engine. This data can be visualized using an interactive graph.
There are two ways to view this information on the graph:
Component Storage
This option visualizes storage data using a stacked area series chart, offering a detailed breakdown of storage components on the engine. By default, the chart displays data for the last 3 months, with an option to extend the view to the last 6 months using a dropdown. This provides a comprehensive understanding of space allocation and utilization over time.
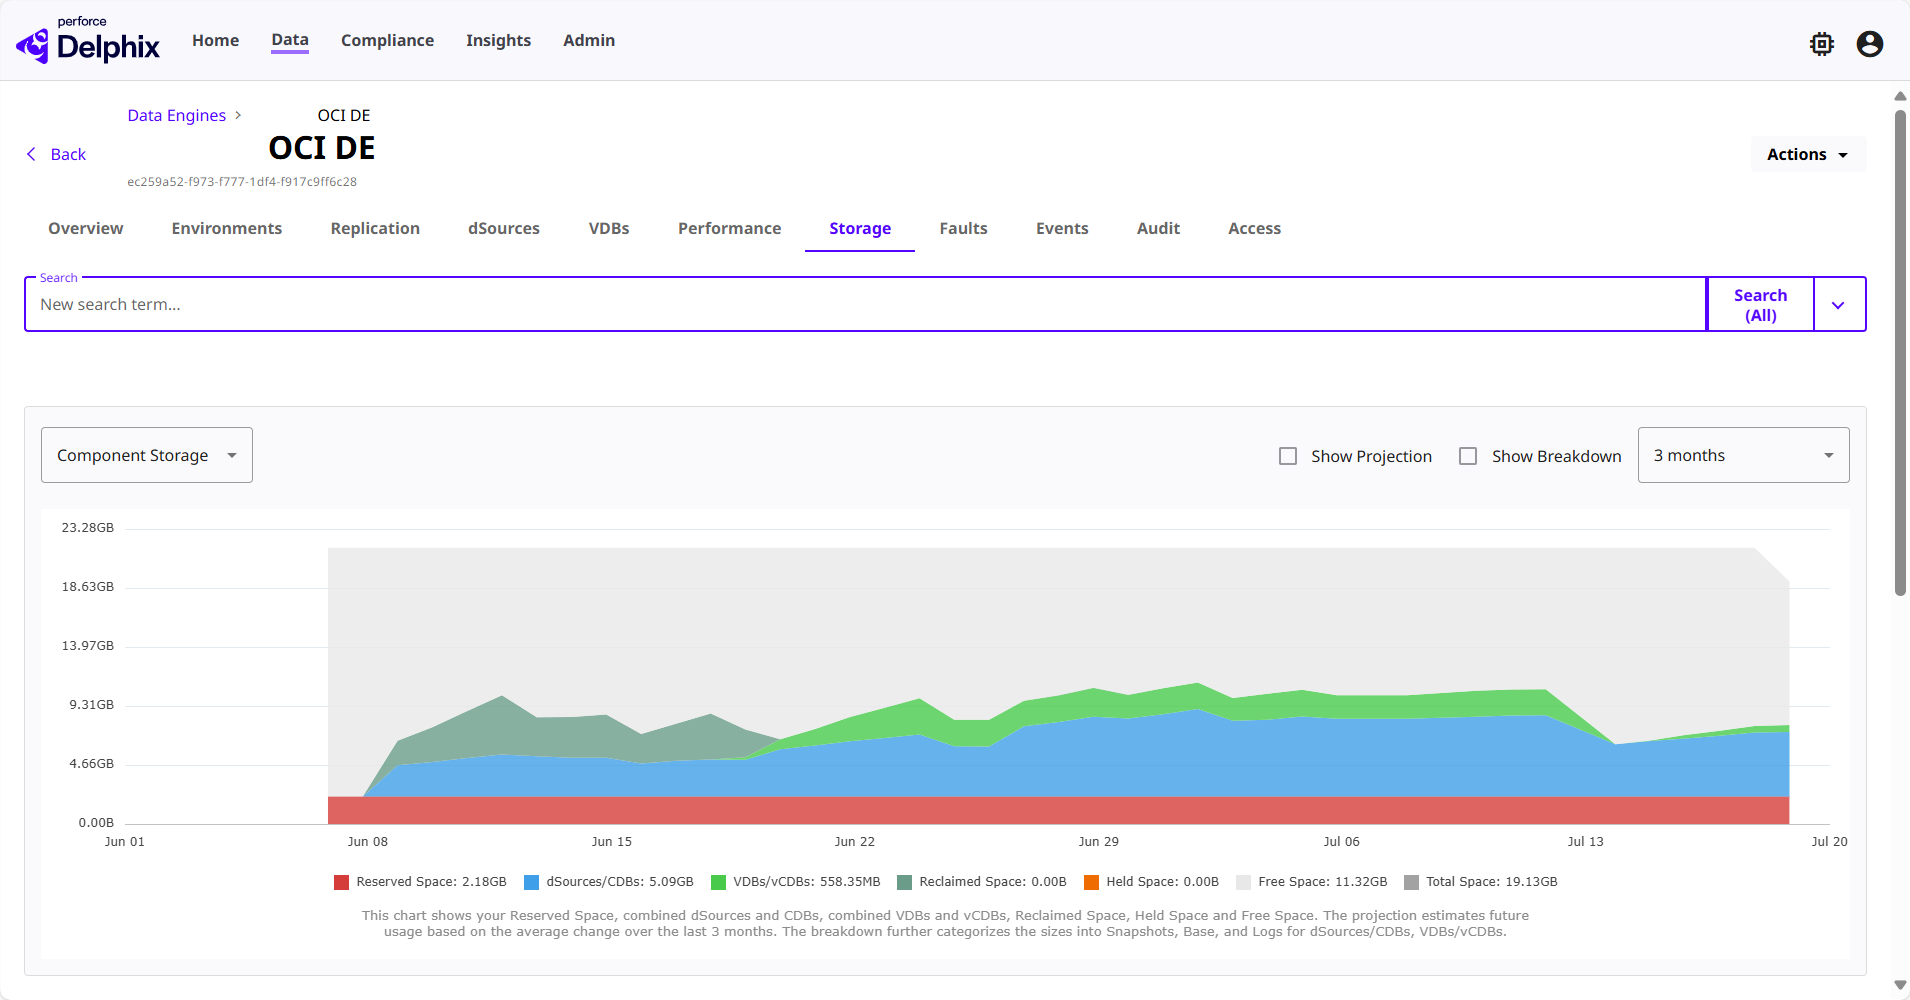
The chart includes the following components:
-
dSources: Represents the storage used by data sources on the engine.
-
VDBs (Virtual Databases): Shows the storage utilized by virtual databases.
-
Held Space: Denotes space reserved or held for specific operations or recovery purposes.
-
Free Capacity: Indicates the remaining available storage on the engine.
-
Reserved Space: Displays the space allocated for future use or reserved for system operations.
Additionally, the chart includes the following features:
-
Show Breakdown: A checkbox that enables further segmentation of dSources and VDBs storage into logs, base, and snapshot sizes, offering a more granular view of storage usage.
-
Show Projection: A checkbox that allows users to view projected storage trends, helping in future capacity planning.
When Show Breakdown is enabled, a table listing every dataset on the engine appears below the chart. Each row includes the dataset name, whether it's a replica, the dataset type (dSource, CDB, or VDB), and its total, base, snapshot, and log sizes, along with any associated tags. Selecting a dataset name opens its detail page, and each column can be filtered to help you locate specific datasets.
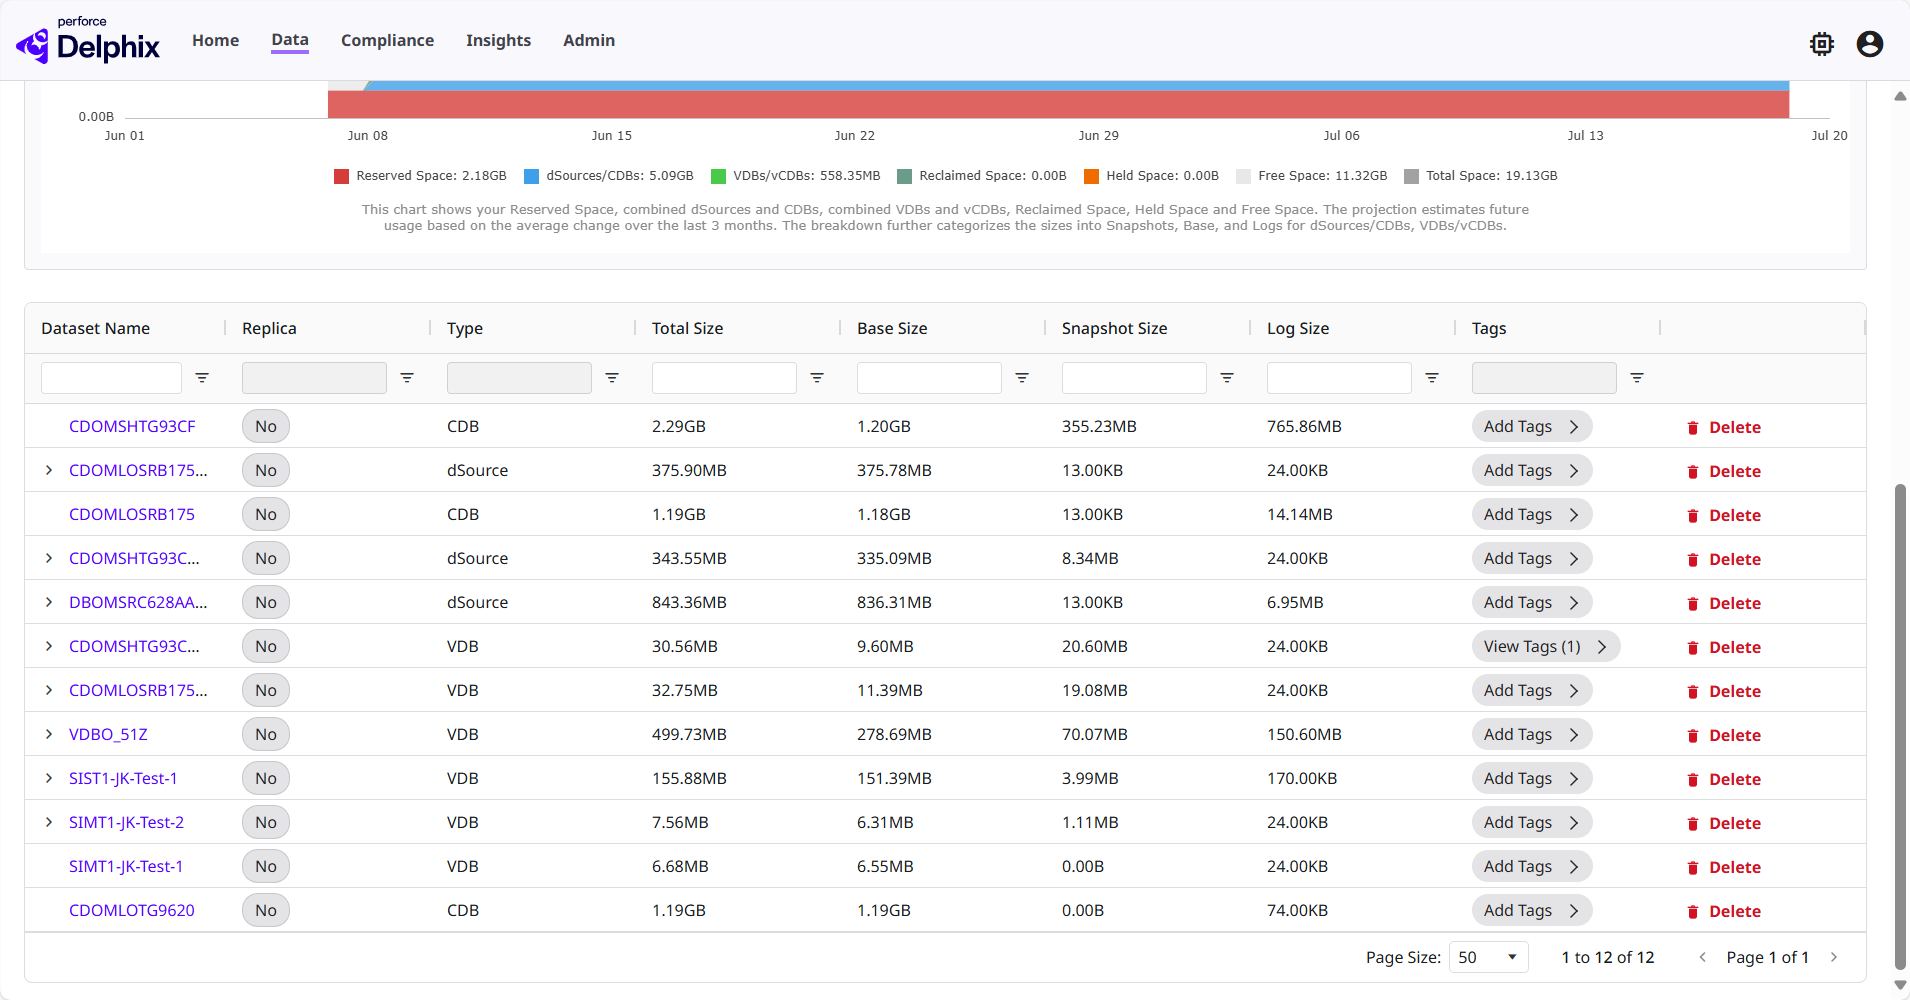
The Snapshot Size column is especially useful for identifying datasets that are consuming a disproportionate amount of storage due to retained snapshots. Reviewing this column can help you determine whether a dataset's snapshot policy needs adjustment to free up space on the engine.
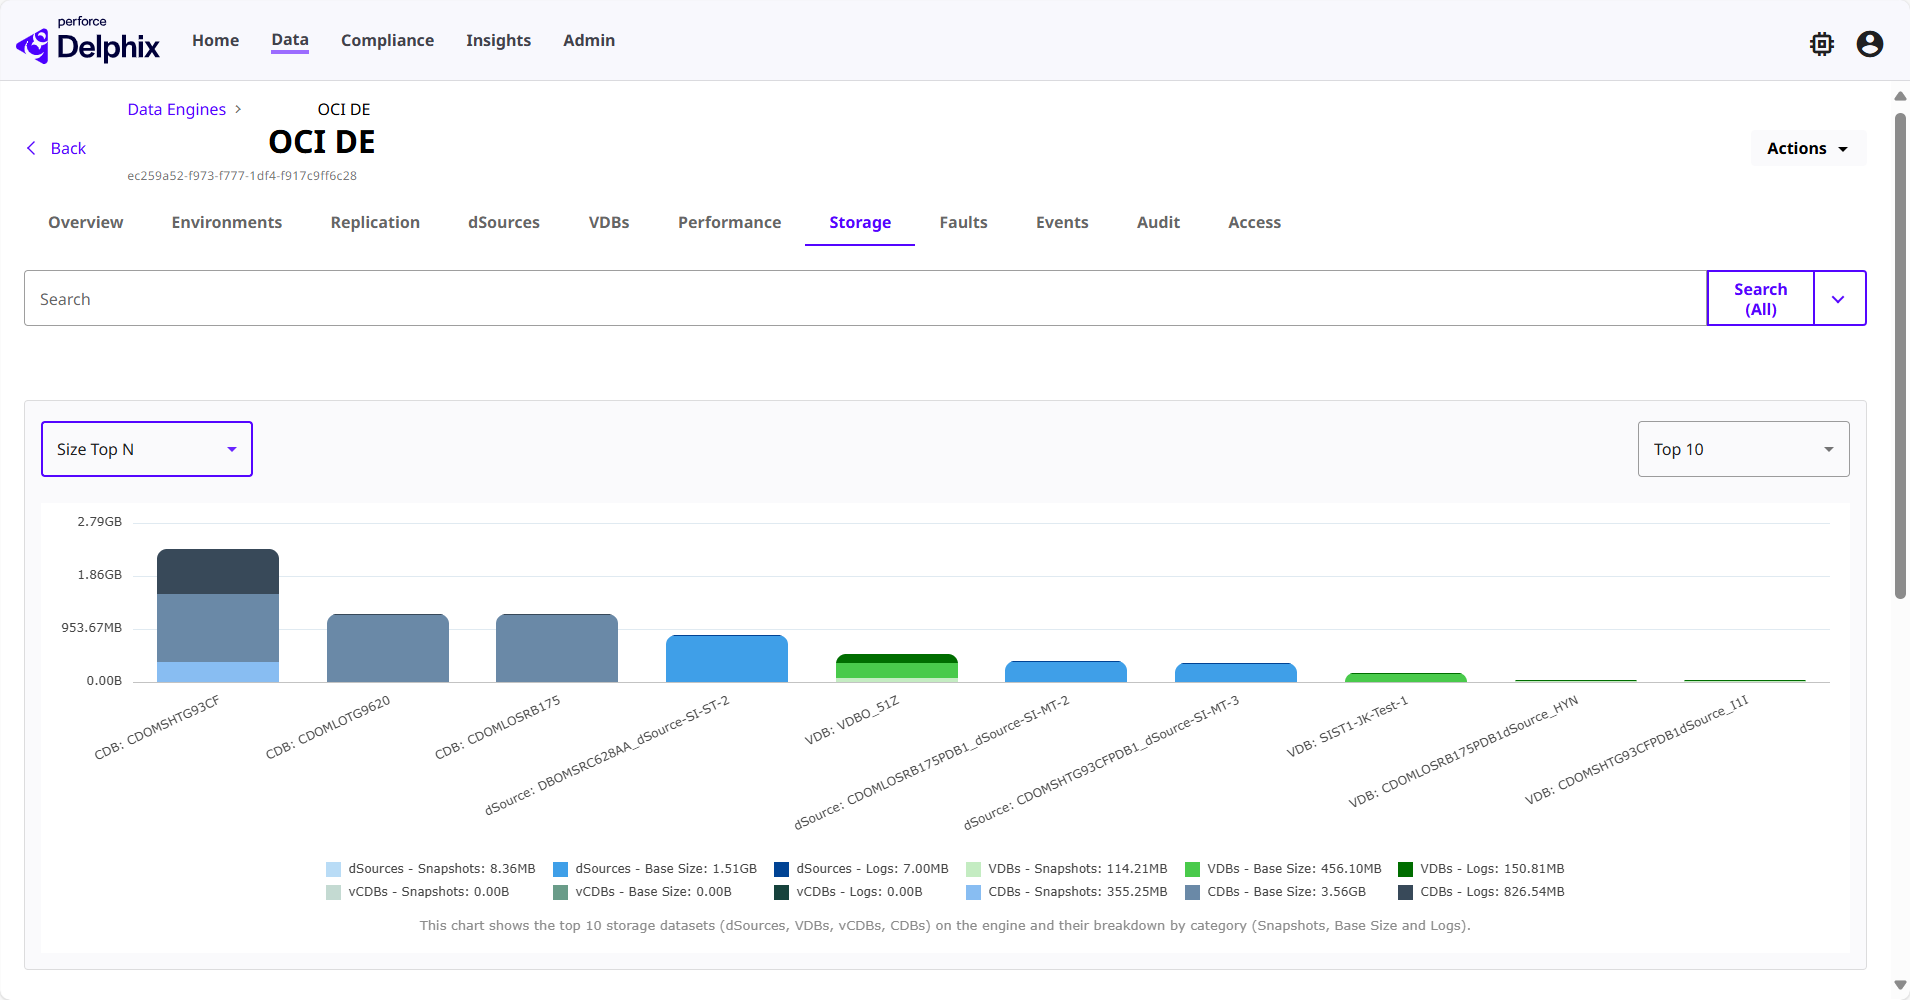
Size Top N
This option visualizes storage data for dSources and VDBs using a stacked bar series chart. The chart displays the top 10 dSources and VDBs by default, with an option to view the top 15 datasets using a dropdown. The visualization provides a detailed breakdown of storage components, including logs, base, and snapshot sizes, allowing users to analyze and compare storage usage effectively.