Operations in DCT
The Operations page is available under the Admin menu, showing a comprehensive list of all the DCT Jobs across Delphix infrastructures. It only shows operations that the user has access to.
The Operations Monitoring feature allows users, such as Database Administrators (DBA), Developers, CISOs, and Database Managers, to monitor system operations related to data virtualization and masking. Users can view all operations and their statuses (completed, in progress, or error) on the Operations page.
This page will display operations based on the user’s read permission on the associated object. Click on a specific operation to view additional details, including the related object name, the operation type, the current status, a progress indicator (if in progress), and any additional metadata related to the operation.
The Operations page is accessible from Administration > Operations or the View All button on the Operations Monitor Bar, which is described below.
Relevant details for the operation are shown, such as status with a graphical progress bar for running jobs, type of job, target id (refers to the id of the object on which the operation has been performed), start time, last updated time, etc. In versions 10.0.0 and above, a column shows the initiator of the operation.
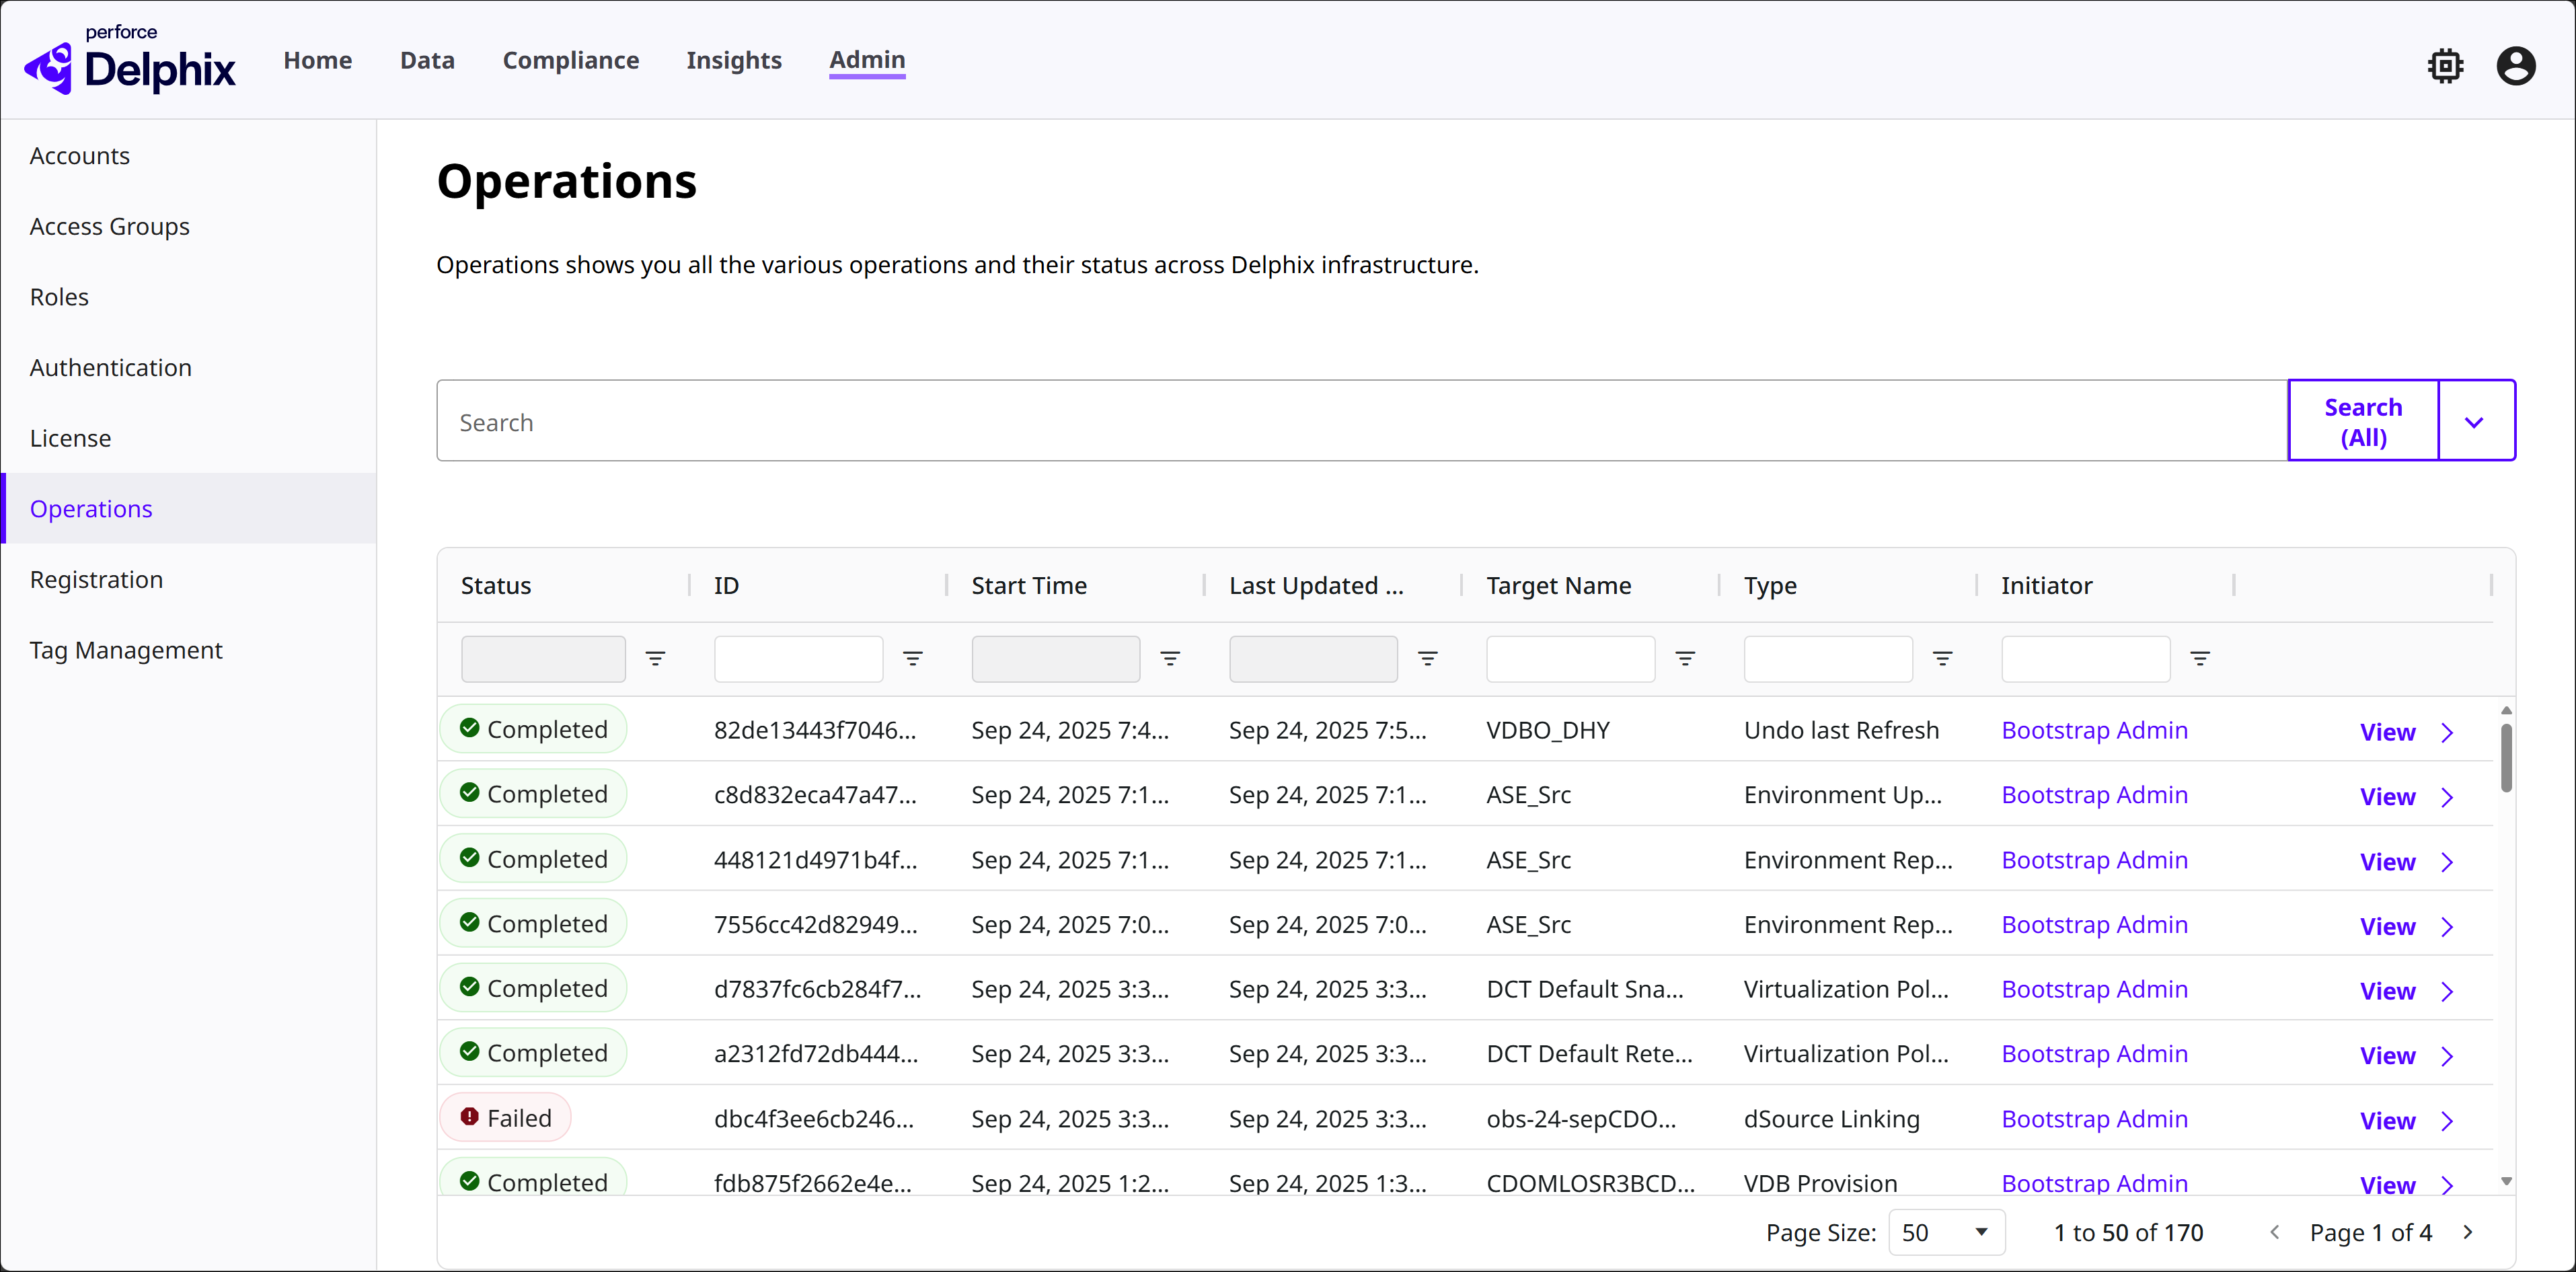
The capture above represents an admin user view of the Operations page, whereas, a standard user would just see jobs associated with their account.
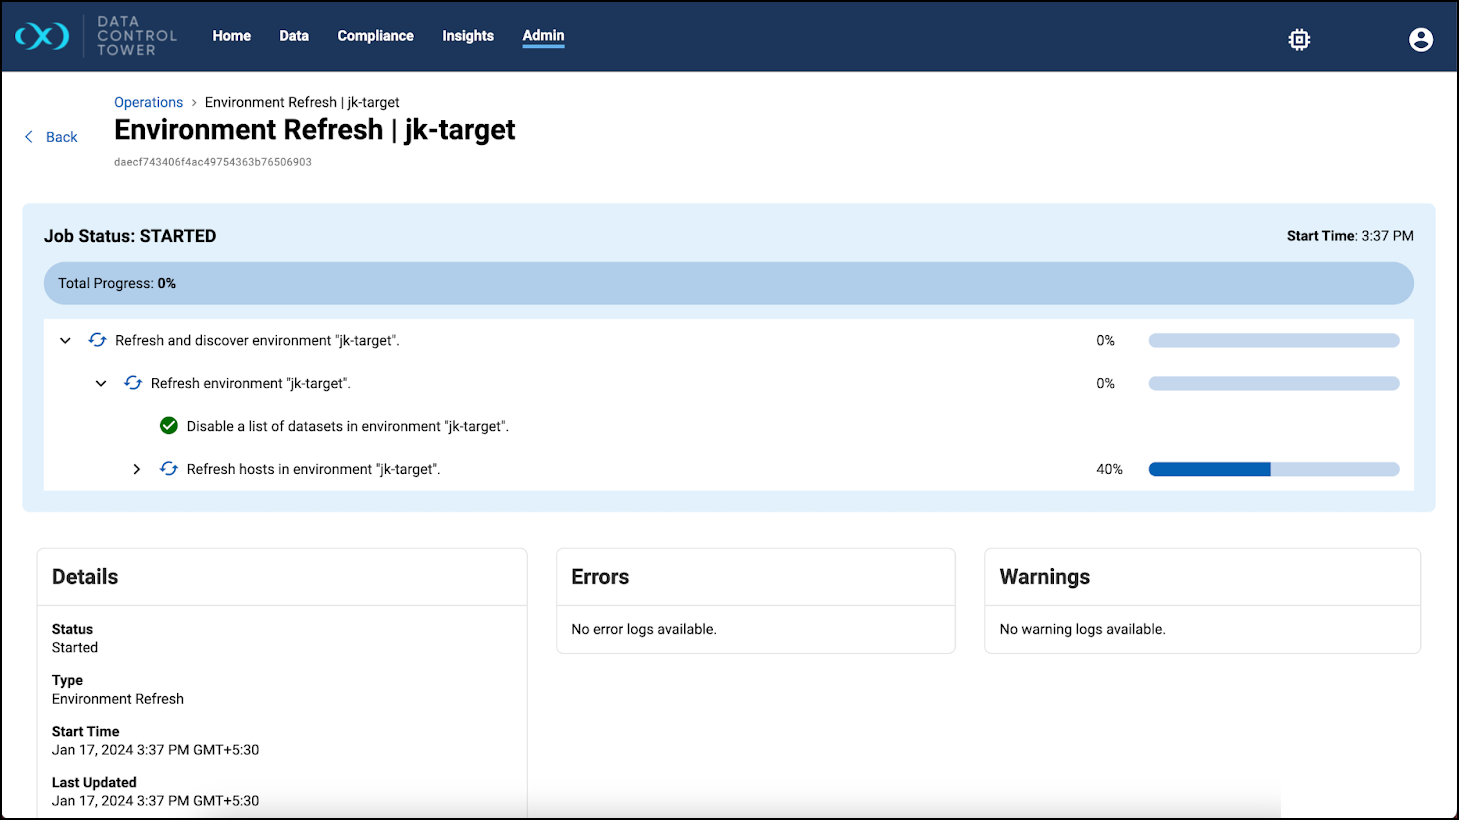
Selecting a job will navigate to the Operations details page, which shows further details for that job, in addition to a progress bar. The details include target id, error, and warning logs. Continuous Data operations are the jobs initiated by the engine, as shown in the action sidebar.
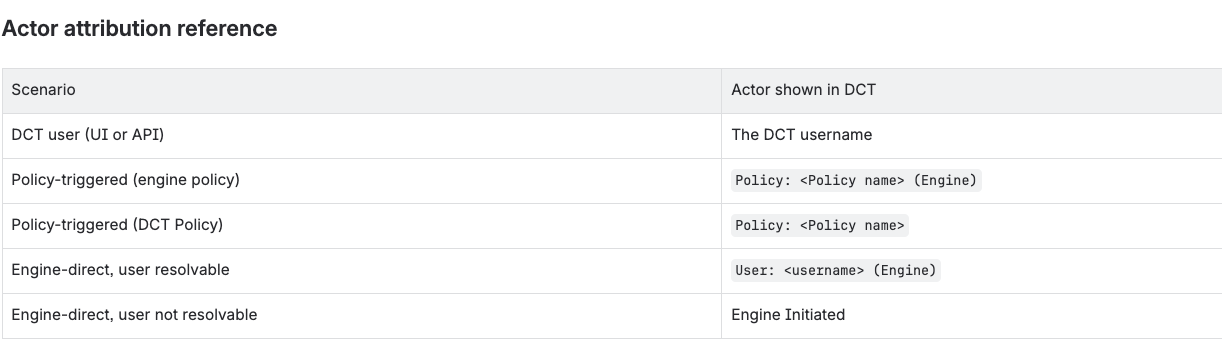
The Operations page shows operations from multiple sources. In DCT, these sources include DCT-initiated actions, Policy-triggered jobs, and Engine-initiated actions performed directly on the connected engine. Policy-triggered operations from an engine are attributed as Policy: <Policy name> (Engine). Policy-triggered operations from DCT are attributed as Policy: <Policy name>. Engine-initiated operations show User: <username> (Engine) when the initiating user can be resolved; otherwise, they show Engine Initiated. Policy-triggered operations are shown by default. Engine-initiated operations are hidden by default. This gives administrators a single place to review the full lifecycle of virtualization events.
The system will execute operations either manually by users or by automated tasks. If an operation encounters an error, the error details can be viewed on the Operation Details page. Failed Virtualization operations can include a Description, Recommended Action, and Command Output in DCT. Each field is shown only when details are available for that field. This allows administrators to diagnose the failure without opening the engine UI. Notifications based on operation status changes are not covered in this topic.
For engine upgrade orchestration, DCT records the operation as a UPGRADE_ENGINE_OPERATION job type. Selecting this job from the Operations list opens its Operation details page, where operators can monitor the current upgrade phase and, if the upgrade reaches a Deferred state, view the corresponding status and error details.
Failure detail
When a Virtualization operation fails, the Operation Details page includes the following fields:
-
Description — when available, a concise summary of the failure.
-
Recommended Action — when available, a suggested remediation or next step.
-
Command Output — when available, the underlying engine command output that helps diagnose the failure.
Operation history and events
When you first connect an engine, DCT imports only the 10,000 most recent operations from that engine. Older operation history is not imported. After the initial connection, DCT captures new operations in real time.
The Operation Details page includes a Job Events table for DCT-triggered and engine-triggered operations. The table has Timestamp and Description columns, displays the most recent event first, and shows one row for each event without truncating the event description.
On replica-target engines with duplicate policy names, the policy link in the Initiator column might not appear. This limitation will be resolved when the engine transmits work_source_ref.
Operation filters and exclusions
Use the operation source filter to filter operations by work_source_type:
DIRECT— engine-direct operations.POLICY— policy-triggered operations.SYSTEM— system operations.
DCT-initiated operations have a null work_source_type and are attributed by account_id.
The Operations page excludes the following engine action types because they are authentication events or engine-internal housekeeping actions:
AUTH_REVOKE_OBJECTAUTH_REVOKE_USERFILE_UPLOADJETSTREAM_ADMIN_STACK_STARTUP_CLEANUPMASKINGJOB_FETCHMASKING_SERVICE_CHECK_LOCAL_STATUSSUPERUSER_SESSION_LOG_DELETESUPERUSER_SESSION_LOG_DOWNLOADUSER_FAILED_LOGINUSER_LOGINUSER_LOGOUTUSER_OAUTH2_FAILED_LOGINUSER_OAUTH2_LOGINUSER_SSO_FAILED_LOGINUSER_SSO_LOGINUSER_UNIFIED_AUTH_FAILED_LOGINUSER_UNIFIED_AUTH_LOGIN
Operations Monitor Bar
The Operations Monitor Bar appears at the bottom of pages to display user-initiated operations, with those completed being auto-dismissed. Operations with errors or in progress remain until the user dismisses them from the bar. In-progress operations display the operation type and object name. By default, the Operations Monitoring Bar toggle button will be available on all pages of the application.
When logging into the application, the Operations Monitoring Bar will be hidden by default. There will be two triggers for showing it:
-
Click on the icon (Operations Monitor Bar toggle button) in the top right.
-
Initiate an action like VDB refresh or compliance operation execution.
The bar has a View All button that navigates to the full Operations page and an actions menu, represented by a vertical "more" icon, that displays available actions for that operation. Visibility of the bar can be toggled on from the “memory” icon in the top right corner.
The Operations Monitoring Bar will show the following:
-
Operations initiated by the user.
-
Operations initiated during the current session.
-
Initially the Operations Monitoring Bar will always be empty upon login.
-
-
Operations marked as Monitor by the user in the full Operations page.
-
Operations currently running and failed.
Additional notes
-
Close and reopen the Operations Monitoring Bar as needed by using the toggle button located in the top right corner (within the top banner).
-
The successfully completed operations will auto dismiss. In other words, when any operation completes, the status changes from RUNNING to COMPLETED and it will be auto-dismissed/auto-removed from the Operations Monitor Bar. For any other status, such as CANCELED, ABANDONED, FAILED, SUSPENDED, TIMEOUT etc., auto dismiss will not occur.
-
Click the three-dot menu icon on any operation in the Operations Monitor Bar to dismiss and remove any operation from the Operations Monitor Bar by selecting this action from the
-
When logging out and logging in again, the Operations Monitoring Bar will revert to being empty. The application will not retain the state of the Operations Monitoring Bar between user sessions.
-
The View All button will navigate users to the Operations page.
-
The View Details button will navigate users to the Details page of the specific operation.