Engine storage report
The Storage tab on an Engine's details page provides information about the data that occupies engine storage. This data can be visualized using an interactive graph or a multi-column table.
The graph has a drop-down list with two ways to view the data: Component Storage and Size Top N. In addition,
Component Storage
This option visualizes storage data using a stacked area series chart. By default, the chart displays data for the last three (3) months, with an option to extend the view to the last 6 months using a drop-down. This provides a comprehensive understanding of space allocation and utilization over time.
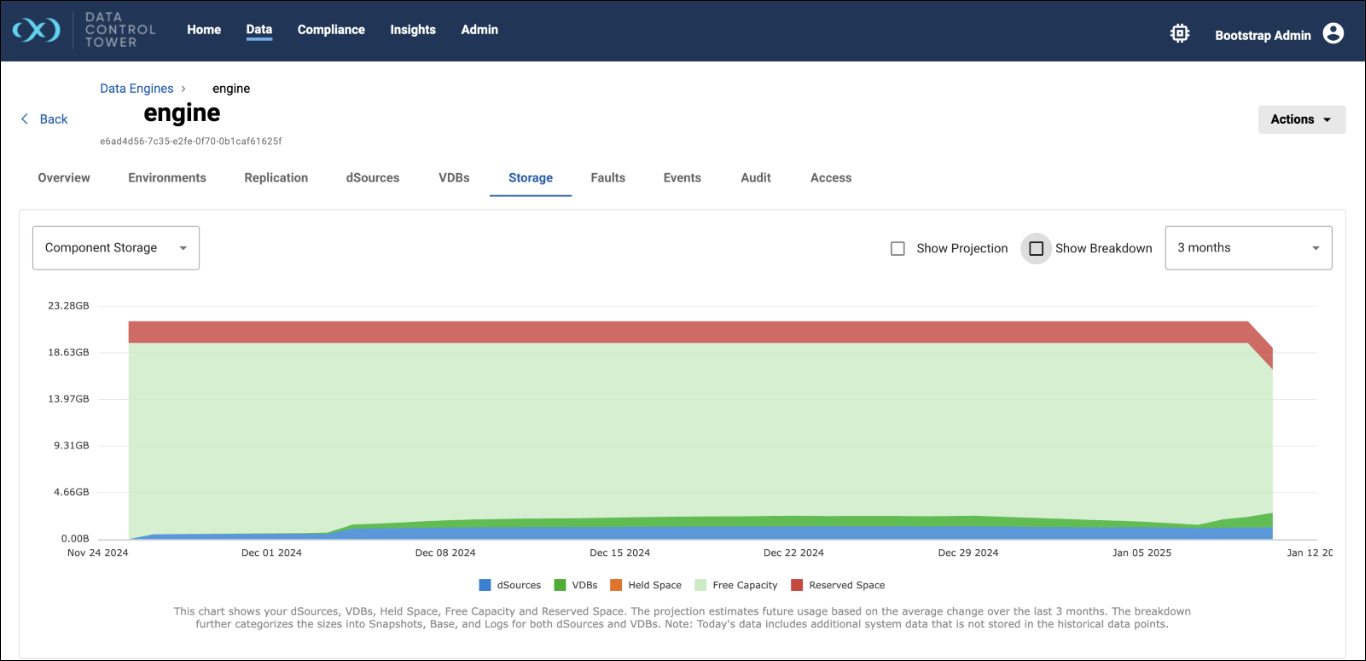
This chart includes the following components:
-
dSources: Represents the storage used by data sources on the engine.
-
VDBs (virtual databases): Shows the storage utilized by virtual databases.
-
Held Space: Denotes space reserved or held for specific operations or recovery purposes.
-
Free Capacity: Indicates the remaining available storage for further TDM usage.
-
Reserved Space: Displays the space allocated for future use or reserved for system operations.
And two check boxes:
-
Show Breakdown: A check-box that enables further segmentation of dSources and VDBs storage into logs, base, and snapshot sizes, offering a more granular view of storage usage.
-
Show Projection: A check-box that allows users to view projected storage trends, helping in future capacity planning.
Size Top N
This option visualizes storage data for dSources and VDBs using a stacked bar series chart. By default, the chart displays the top 10 dSources and VDBs, with an option to view the top 15 datasets using a drop-down. This visualization provides a detailed breakdown of storage components, including Logs, Base Size, and Snapshot Size, allowing users to analyze and compare storage usage effectively.
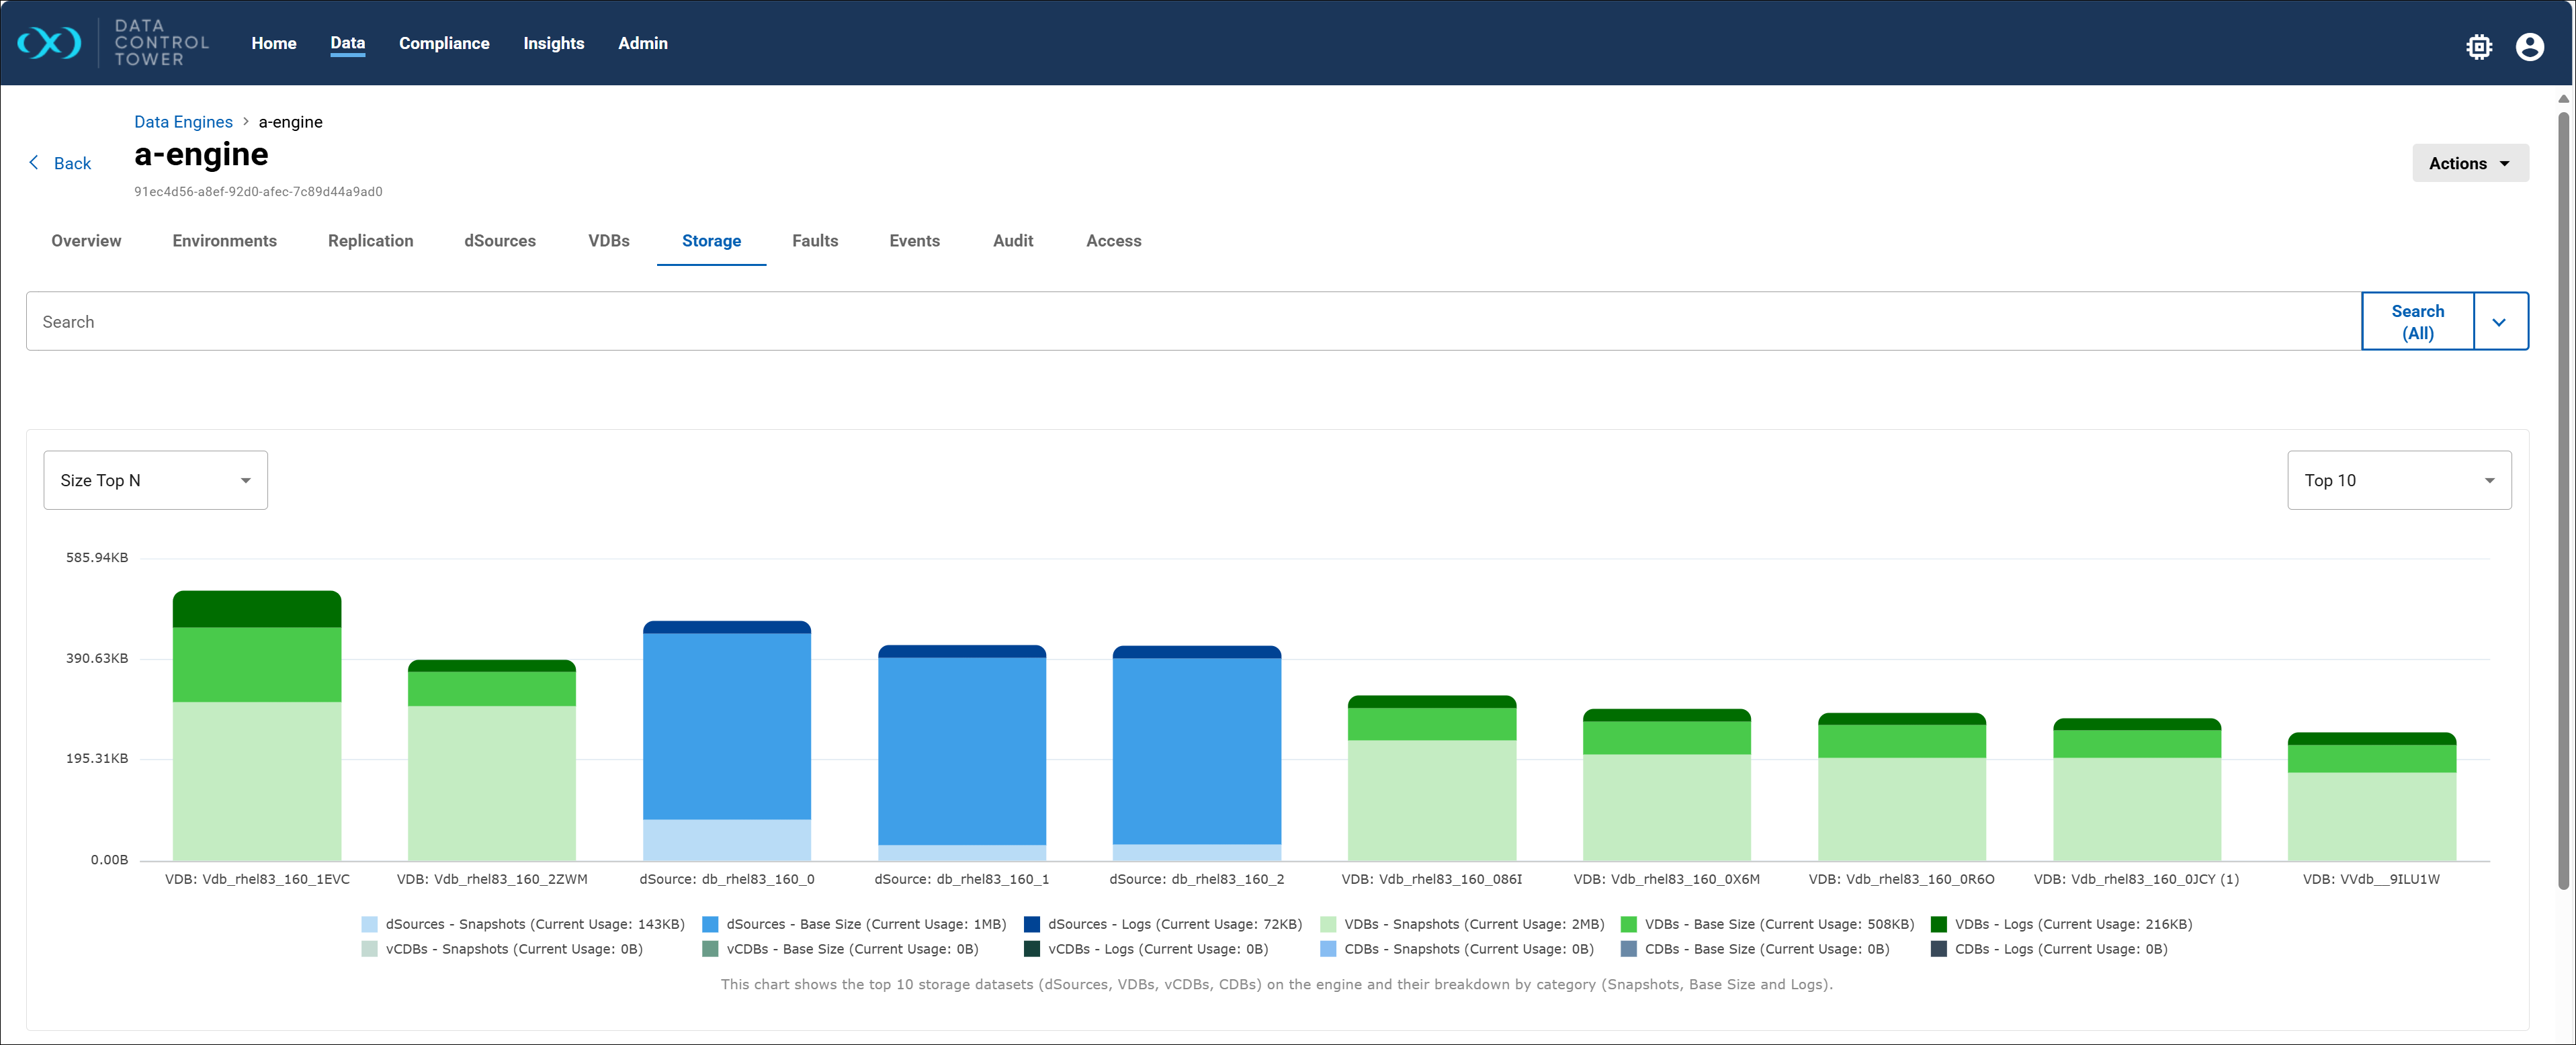
Table view
The Storage tab on an Engine's details page also contains a table view of this data. This provides a granular overview of storage utilization by various objects, including VDBs, dSources, and held space on the Engine. Each listed item presents specific storage metrics such as Base Size, Snapshot Size, and Log Size, with Total Size being the equivalent of all three, to provide visibility on how storage resources are allocated. Actions are available for each line item to Add Tags or Delete. If your engine is experiencing low free storage, this page is a critical tool for managing space.
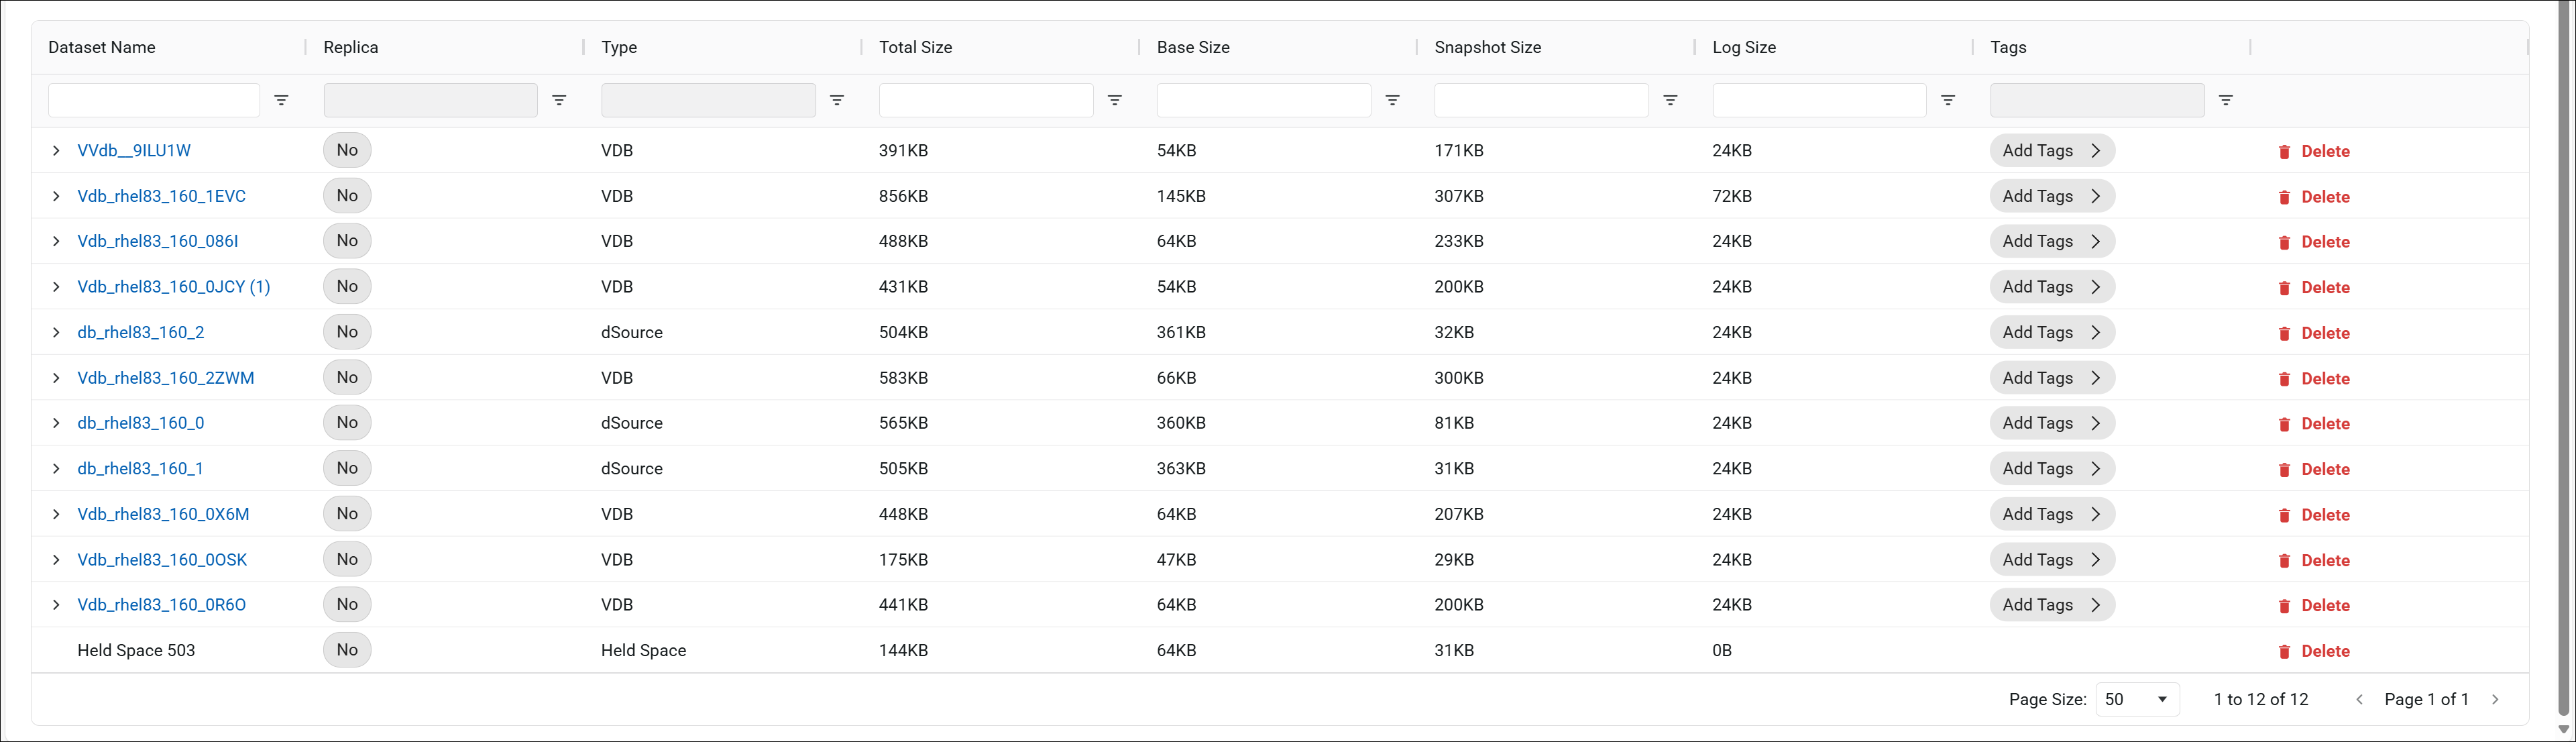
Additionally, you can expand each line item to reveal associated Snapshots and Bookmarks. These snapshots include metadata like the snapshot's creation date, type, dependencies, expiration date, and the space that can potentially be reclaimed (Freeable Size). The sum of all snapshots, combined with freeable and shared storage, represents the Snapshot Size.
-
Hovering the cursor over the Freeable Size and Dependencies column headers shows detailed definitions of the column’s content.
-
Freeable Size and Dependencies columns, and the Delete button will not be shown for a bookmark.
-
Replica datasets will not have a Delete button for Snapshots.
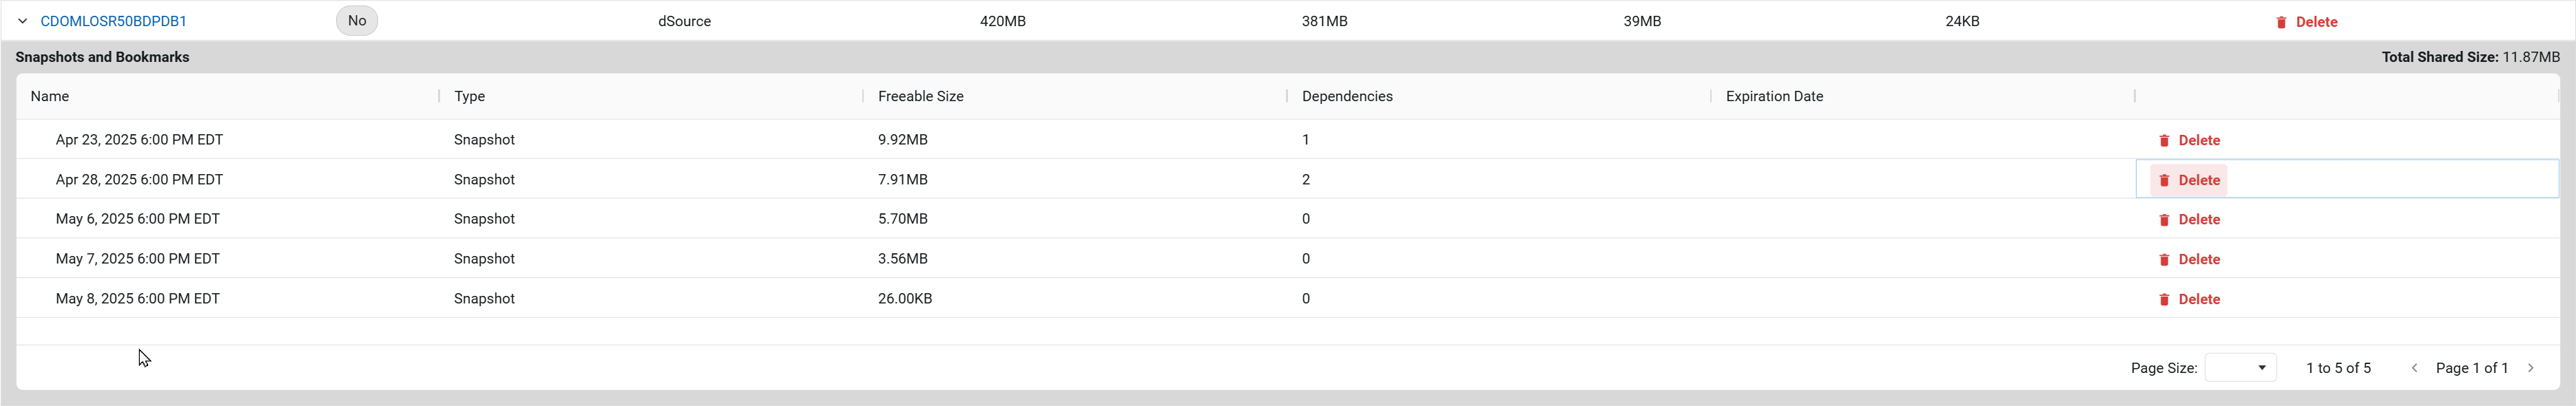
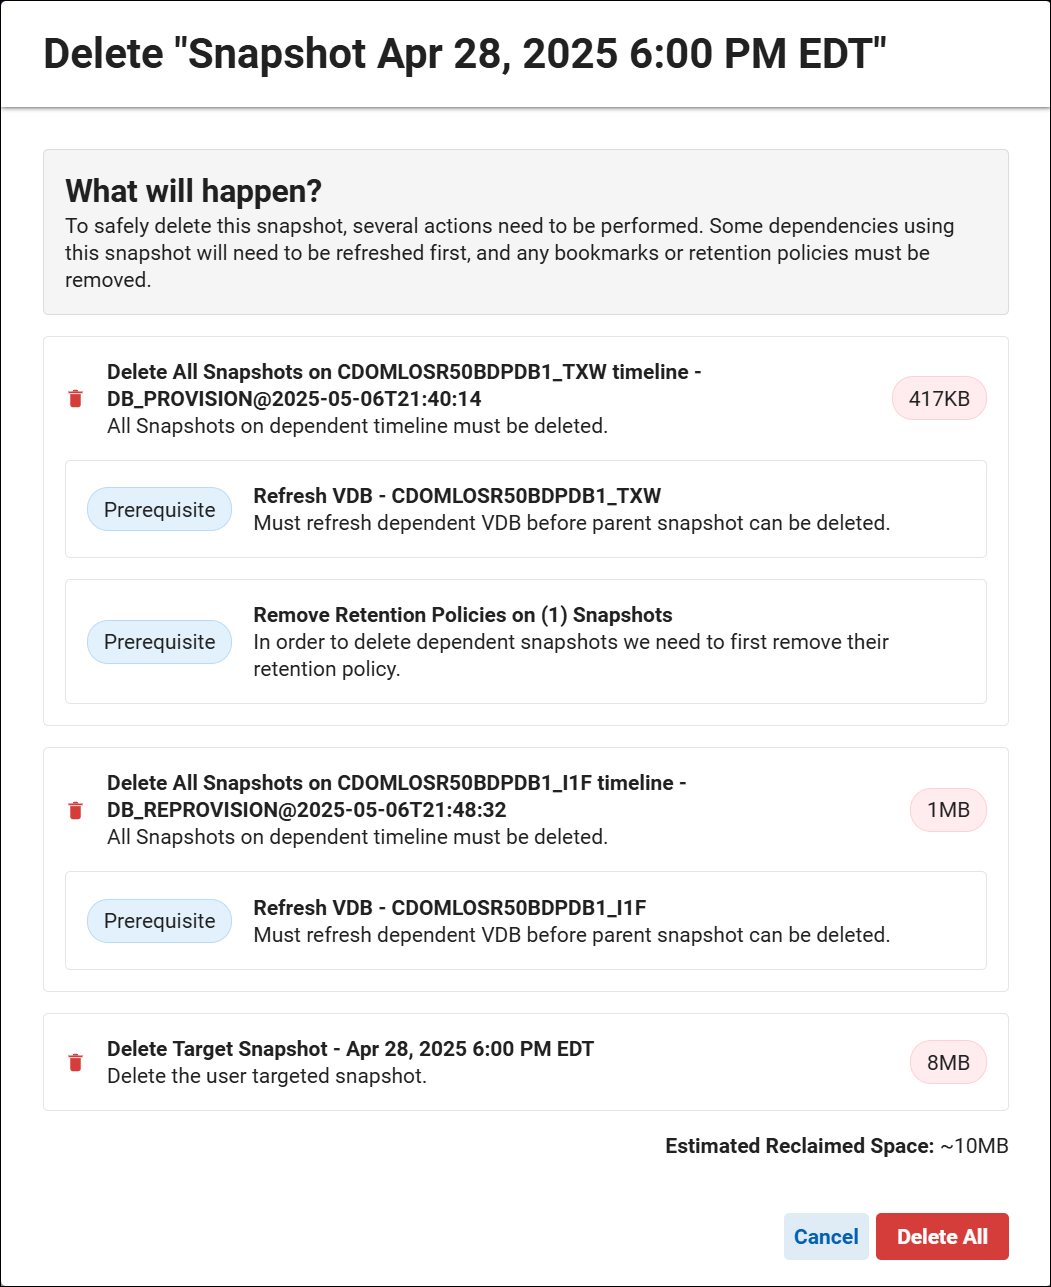
Deleting a seemingly small snapshot can have significant consequences if it has dependencies. Use the following indicators (from the view above) to assess the impact of a deletion:
Freeable Size: Indicates the amount of storage that will be reclaimed after deletion.
Shared Size: Represents the amount of space shared with other objects, which may not be fully recovered.
Dependency Count: Shows the number of objects that rely on the selected item.
Selecting the Delete action for a snapshot line item removes it and any of its dependent objects (bookmarks, retention policies, etc.) from the engine. When the action is selected, all related dependencies will be listed. Review them before engaging the Delete button again, which confirms the action.