Triggering the pipeline
To trigger the pipeline and monitor its progress, follow these steps:
-
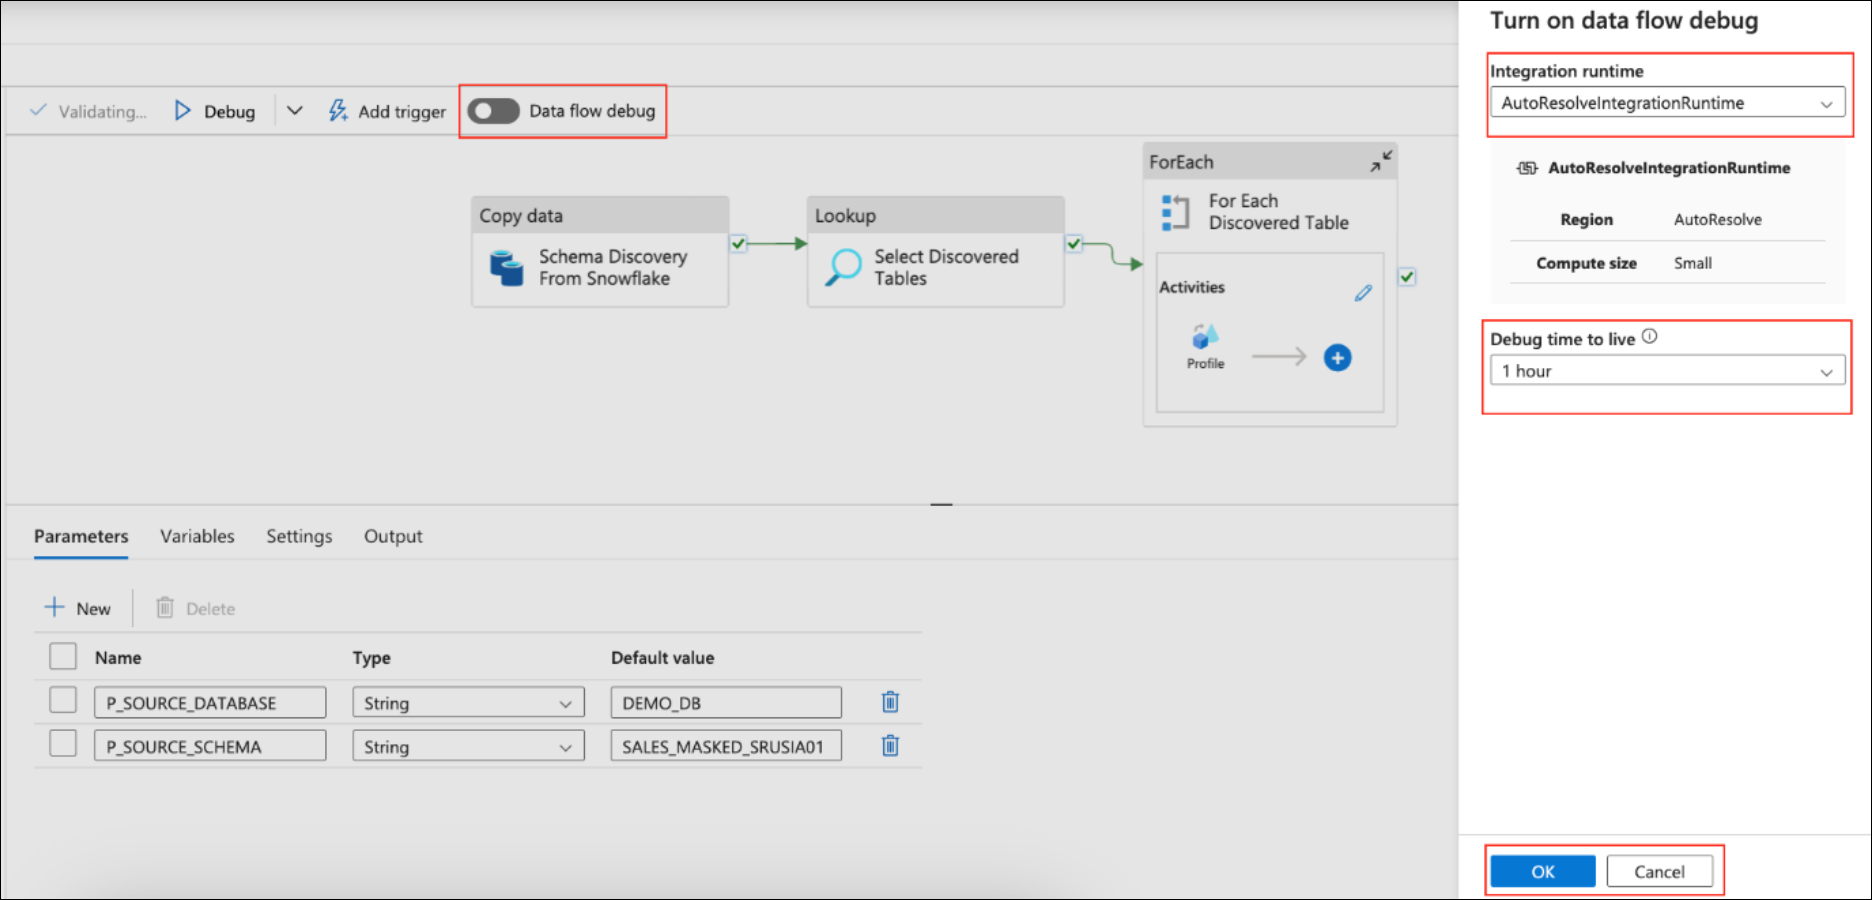
(Optional) Enable data flow debugging by toggling the Data flow debug switch.
-
In the Turn on data flow debug section on the right-hand side, select the desired integration runtime.
-
Set the desired debug time to live (default is 1 hour).
-
Click Ok to enable data flow debugging.
-
-
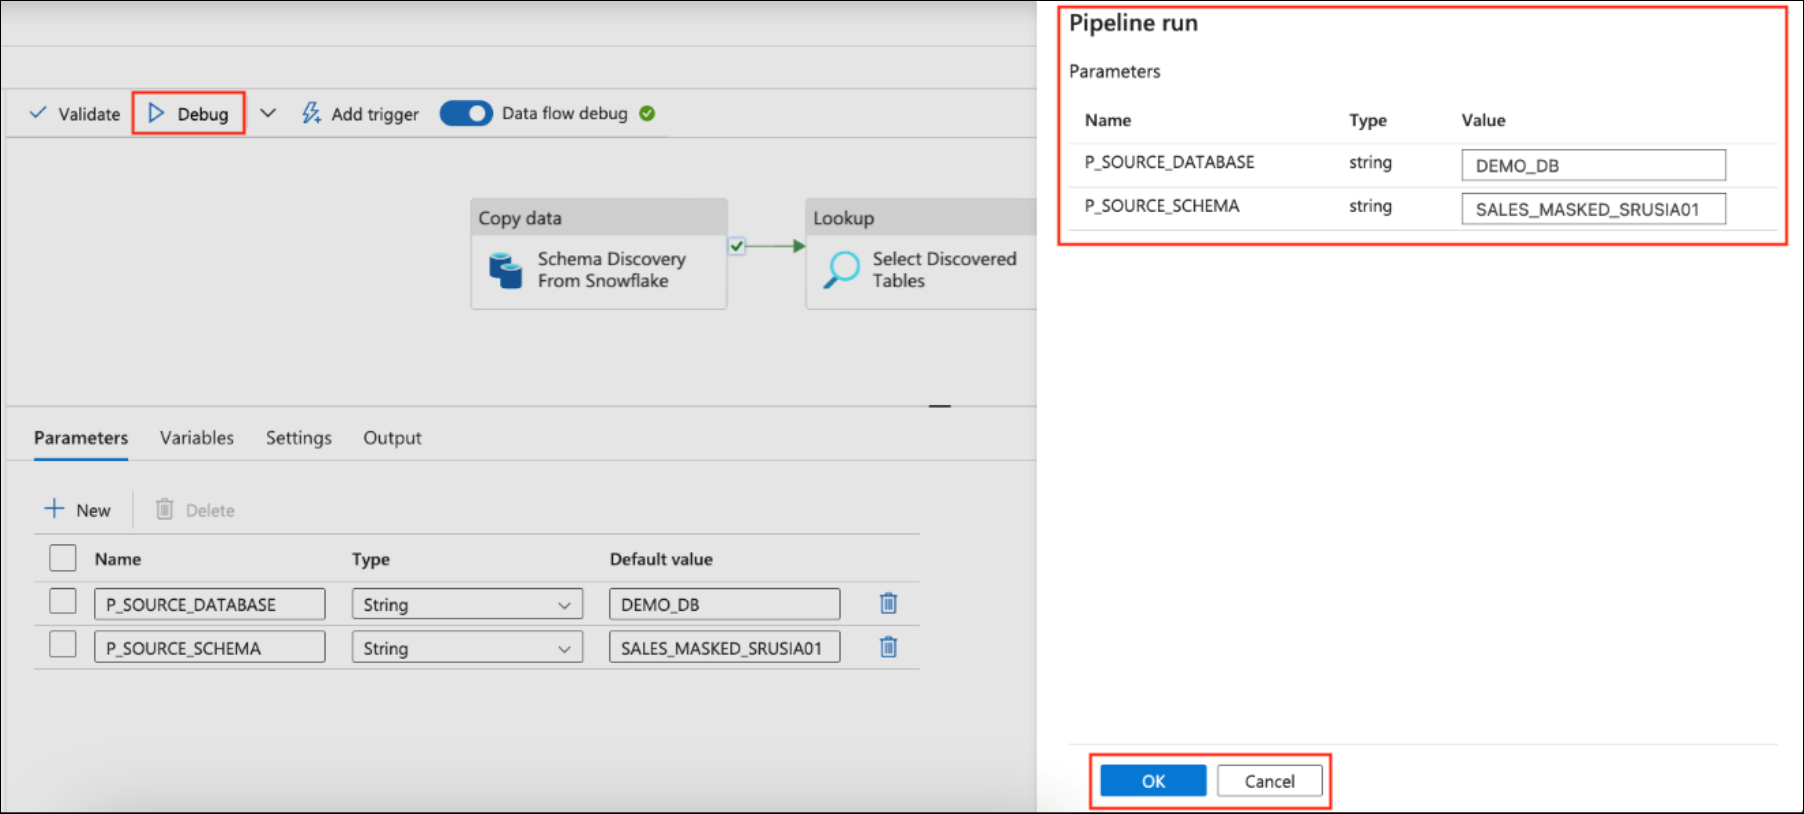
Click the Debug button (located on the left-hand side of the Data flow debug toggle) to start the pipeline run.
-
In the Pipeline run section, enter the required parameter values for the pipeline run.
-
Click Ok at the bottom of the Pipeline run section to initiate the pipeline run.
-
-
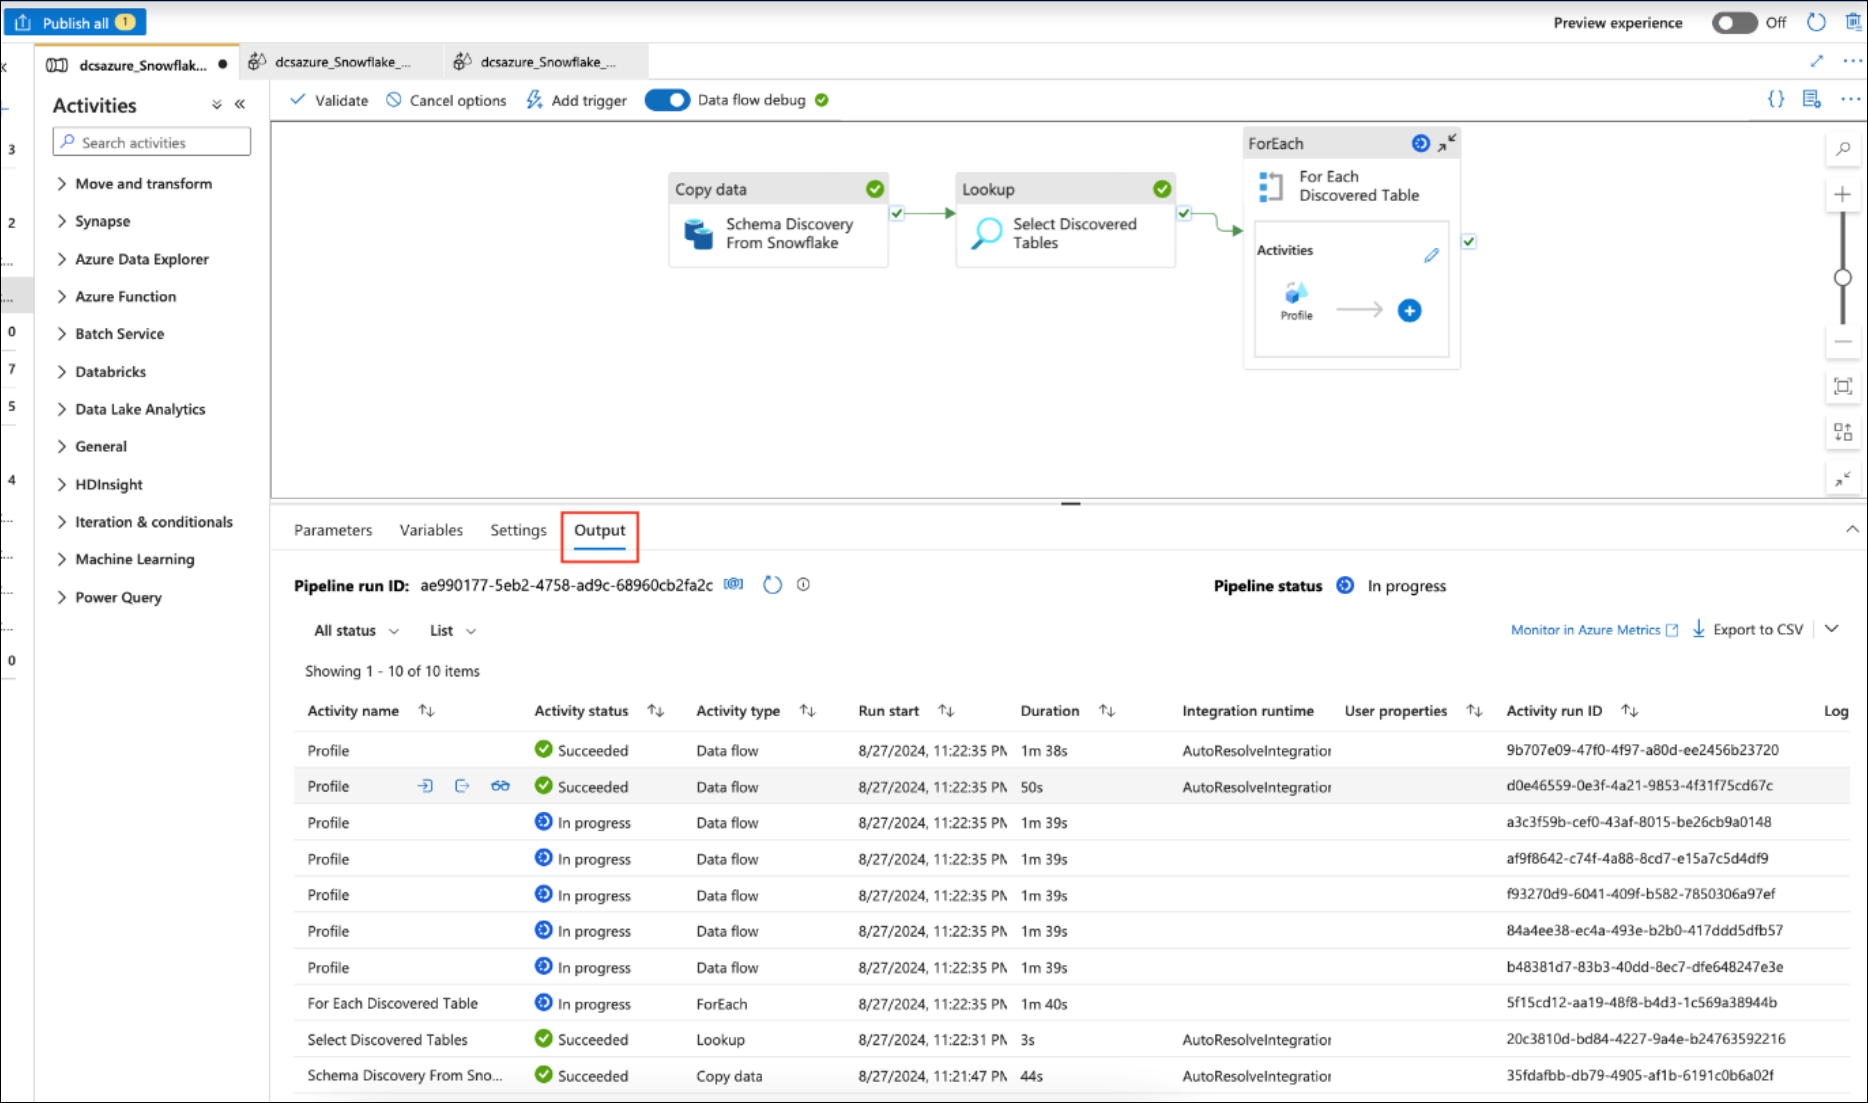
Monitor the pipeline run progress and view the status of completed, failed, or in-progress activities in the Output tab.
-
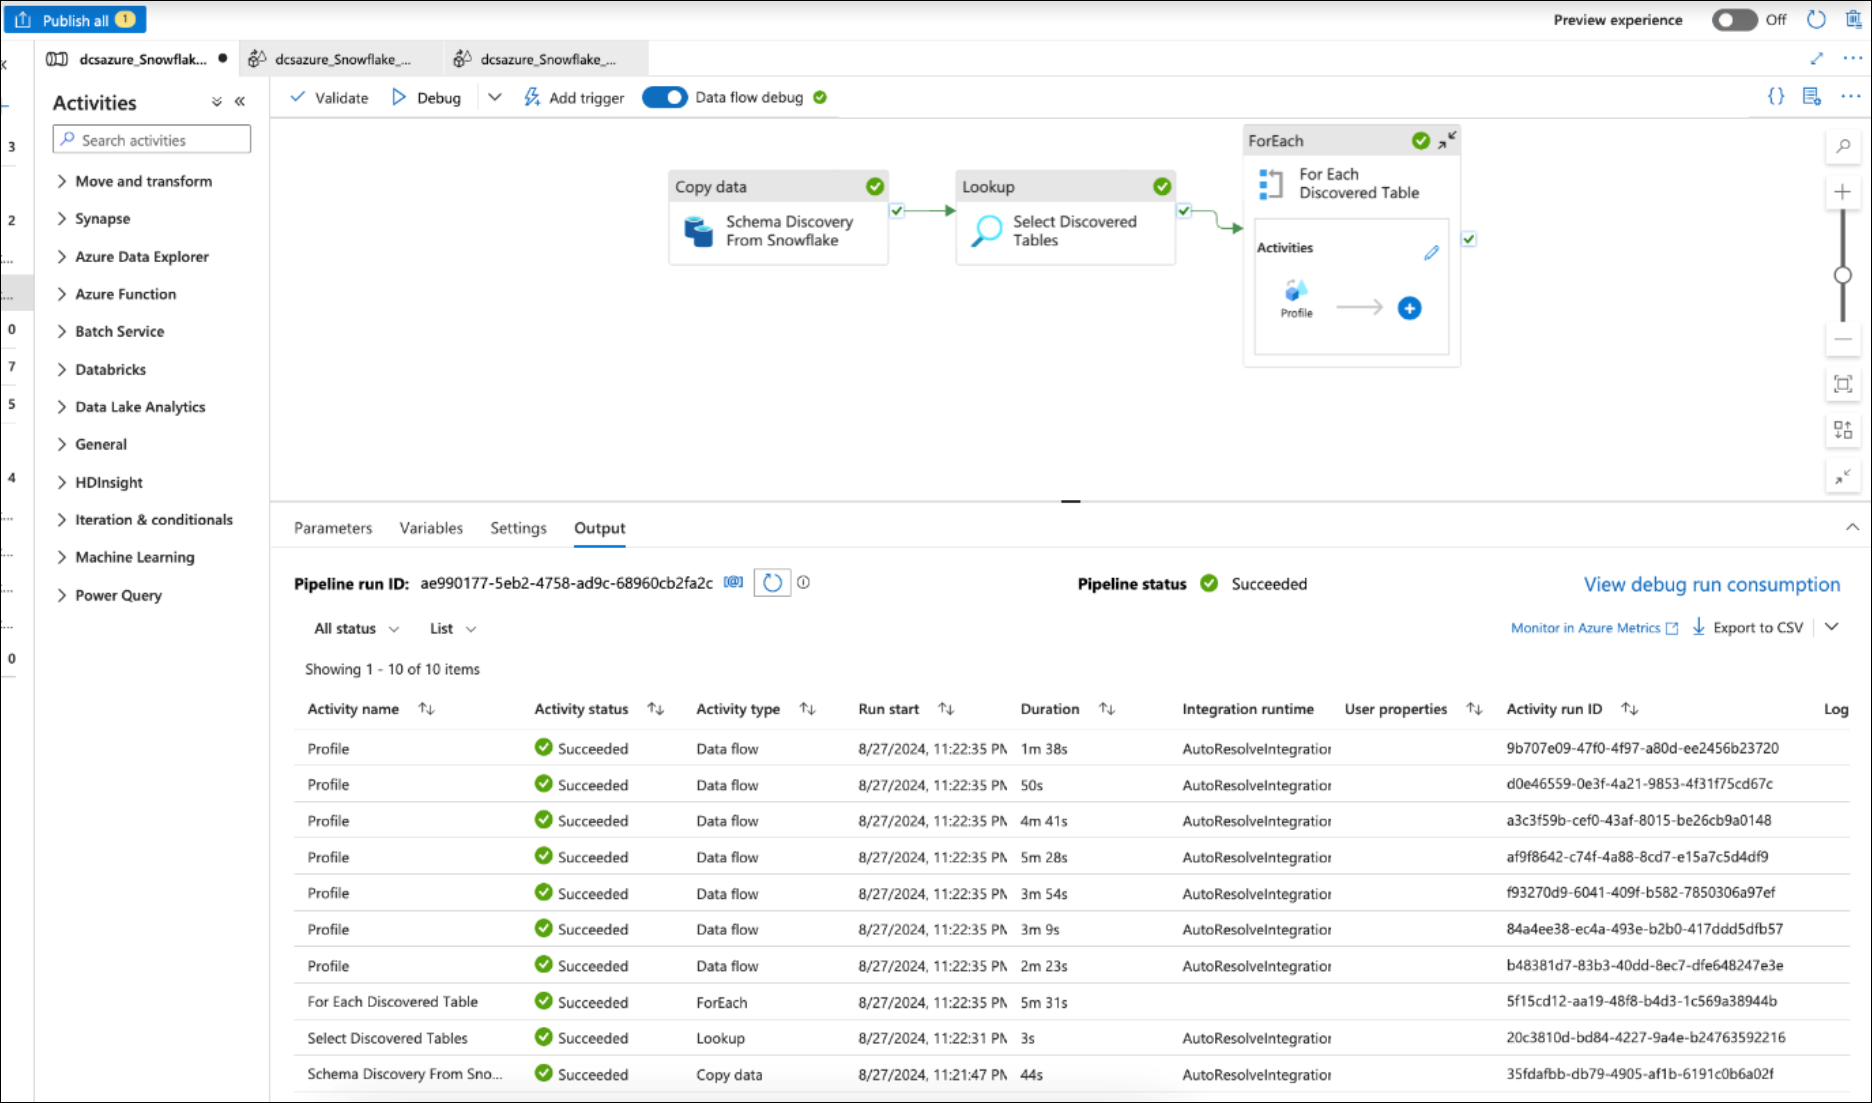
Once the pipeline run is complete, check the Output tab for the pipeline status. It should display Succeeded if the run was successful.


