Configure Splunk
Prerequisites
Before you configure the Delphix Engine, you need to configure and make a note of the following in Splunk:
Delphix only supports Splunk Enterprise 6.3.0 or higher.
-
In the Splunk web UI Enable SSL (this is optional but best practice for security) in your global HTTP Event Collector (HEC) settings.
-
The Splunk hostname or IP Address.
-
The HEC Port number for your Splunk instance (default 8088).
-
Enable the HTTP Event Collector on Splunk, and create a new HEC Token with a new Splunk index set as an allowed index for the token. Make sure Enable Indexer Acknowledgement is unchecked for the token. Warning: You can use a separate Splunk index for performance and capacity metrics (otherwise, the same index will be used for both events and metrics). On Splunk 7.0+, Delphix recommends you create this second index as a special “Metrics” type index that is optimized for indexing and searching metrics data.
-
Note the HEC Token Value and the Allowed Indexes for the token.
The following table provides an example of the data you need:
|
Attribute |
Sample data |
|---|---|
|
Splunk Server IP address |
192.168.8.8 |
|
Splunk Server HEC Port Number |
8088 |
|
Splunk HEC Token |
12345678-1234-1234-1234-1234567890AB |
|
Index Name for Events |
delphix_events |
|
Index Name for Metrics |
delphix_metrics |
Configure Delphix for Splunk
-
Log in to the Delphix Server Setup UI as the sysadmin.
-
Open Preferences > Fluentd Configuration.
-
In the Fluentd Configuration window, enter your Splunk values, using the default splunkHec plugin configuration.
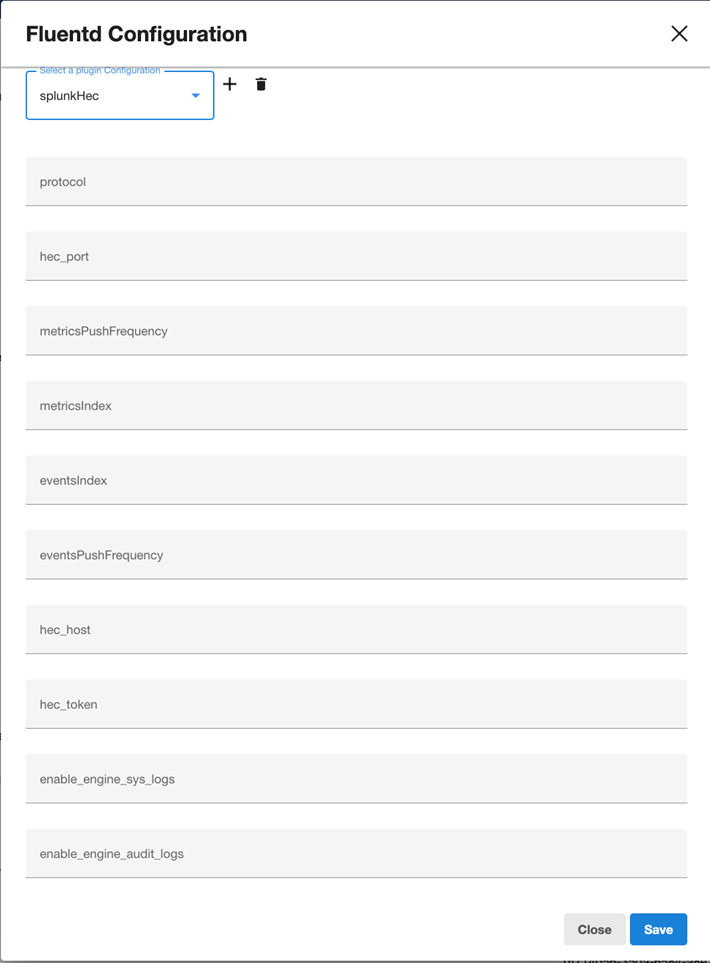
Host
Splunk hostname or IP address
HEC Port
The TCP port number for the Splunk HTTP Event Collector (HEC)
HEC Token
The token for the Splunk HTTP Event Collector (HEC)
Events Index
The Splunk Index events are sent to. You must set it as an allowed index for the HEC token.
Metrics Index
The Splunk Index metrics are sent to. If not specified, the Main Index is used for metrics as well. You must set it as an allowed index for the HEC token.
Events Push Frequency
The frequency at which the Events are pushed to Splunk. Specified in seconds.
Metrics Push Frequency
The frequency at which the Performance Metrics are pushed to Splunk. Specified in seconds
Protocol
What protocol to use (HTTP or HTTPS) when connecting to Splunk. Must match your HTTP Event Collector settings in Splunk.
Enable Engine Syslog Sends syslog data to Splunk if enabled. Enable Engine Audit Log Sends audit log data to Splunk if enabled. -
Enable Engine Syslog and Enable Engine Audit Log must have a boolean string value of "true" or "false" (not case sensitive). If you provide an invalid value, you get a configuration validation error.
-
Click Save to enable the Splunk configuration and begin sending all new Actions, Job Events, Faults, Alerts, and Metrics to your Splunk instance.
Test your connection to Splunk
Delphix sends a test event to Splunk when you click Save. If this test does not receive an OK response, the configuration is not saved and you are prompted to fix the issue. There is no need to separately test the connection when you use the Delphix UI. However, there is also an option for explicitly testing your SplunkHec configuration via the CLI at service fluentd configuration testSplunkHec or by using the API at the /delphix/service/fluentd/configuration/testSplunkHec endpoint.